Based on today's chart for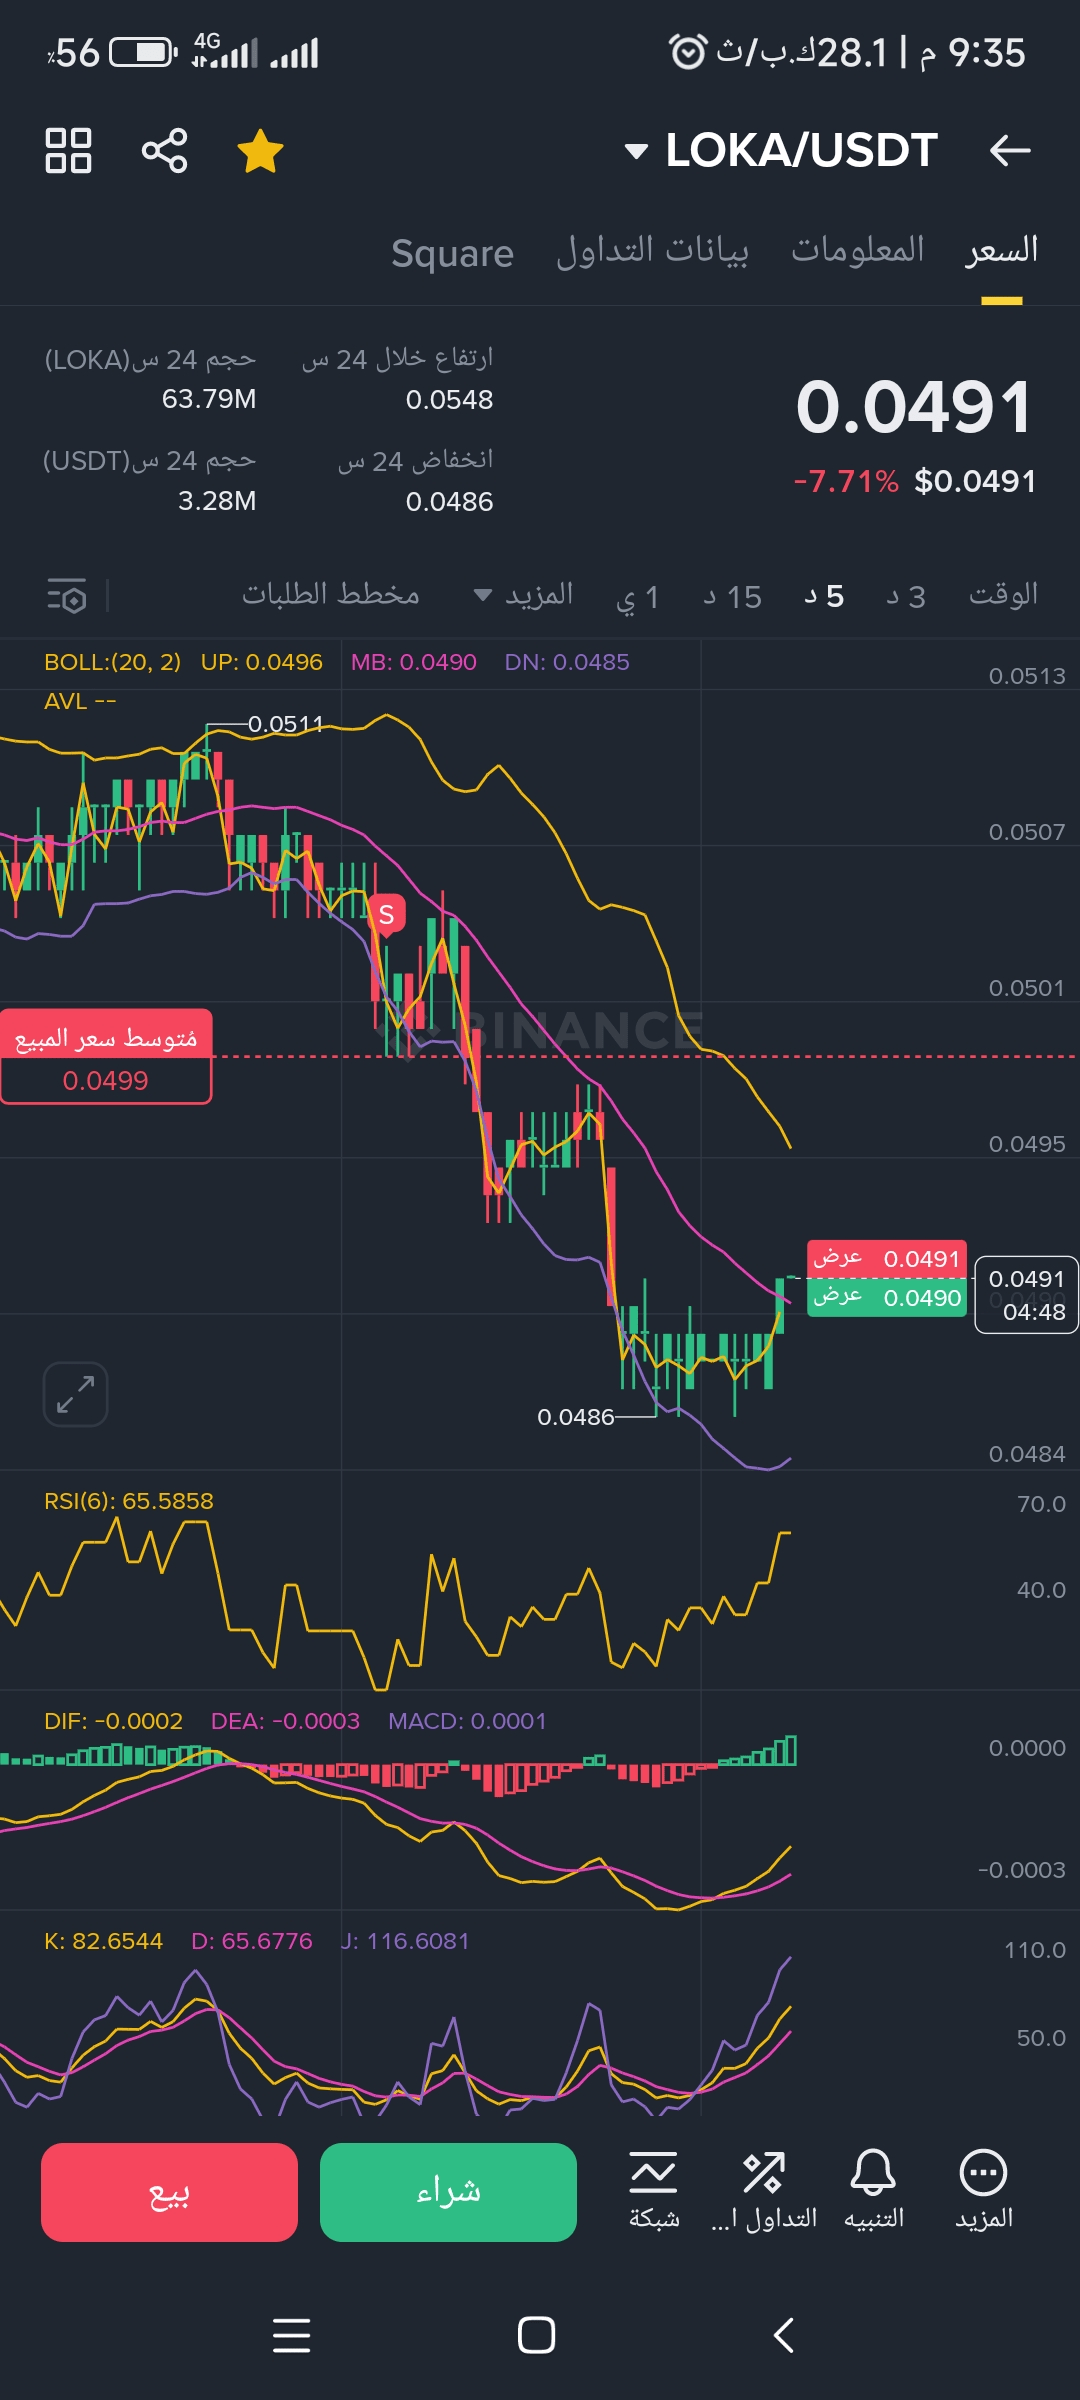 LOKA/USDT:
Current Market Overview:
* Price: $0.0489, down 8.60% today.
* Highest Price in 24 Hours: $0.0548
* Lowest Price in 24 Hours: $0.0486
* Trading volume in the last 24 hours (LOKA): 63.71 million
* Trading volume in the last 24 hours (USDT): 3.28 million
Technical Indicator Analysis:
* Bollinger Band Indicator (BOLL(20, 2)):
* Upper Band (UP): $0.0498
* Middle Band (MB): $0.0491
* Lower Band (DN): $0.0484
* The price is currently near the lower band of the Bollinger Band, which may indicate short-term overselling, but also suggests continued downward momentum.
* Relative Strength Index (RSI(6)): 46.5180. This is in the neutral zone, but leans towards the downside, indicating some weakness. It is not in the extremely oversold zone (typically below 30), so there is still room for further decline.
* MACD Indicator:
* Divergence Line (DIF): -0.0003
* Signal Line (DEA): -0.0003
* MACD: 0.0000
* The MACD lines are very close to each other and slightly negative, indicating weak downward momentum or consolidation. A crossover below zero will confirm a stronger bearish sentiment.
* Stochastic Indicator (K, D, J):
* K: 51.7714
* D: 39.8533
* J: 75.6075
* K and D lines are in the medium range, but J is higher. This indicates mixed signals, but with the recent downward trend, it does not clearly indicate a strong reversal.
Chart Pattern Note:
* The price has been in a clear downward trend recently, breaking what appeared to be previous support levels.
* There is an "Average Selling Price" indicated at $0.0499, which is currently above the market price, suggesting that many new sellers may have sold at a higher price.
* "Average Purchase Price" at $0.0514, which is much higher than the current price, suggesting that new buyers are likely at a loss.
* The overall trend in this timeframe appears to be bearish.
Opinion and Advice:
My opinion based on this chart is that the current trend is bearish. The price has dropped significantly today, and key indicators like the Bollinger Band and visible price action suggest a downward movement.
Advice: Avoid buying at this moment.
Here’s why:
* Strong Downtrend: The price has been continuously moving downward. Buying in a strong downward trend is generally risky, as you may be "catching a falling knife."
* No clear reversal signal: There is no strong visible bullish reversal pattern yet (such as a strong bullish engulfing candle, double bottom, or significant bounce from major support).
* Below Averages: The current price is below the averages of the buying and selling prices shown in the chart, indicating that market participants are losing money recently, which could lead to further selling pressure.
* Relative Strength Index and MACD: While the Relative Strength Index is not in the extremely oversold zone, it does not show strong bullish divergence. The MACD also indicates weakness.
What to consider before making a decision:
* Higher timeframes: This chart appears to be a short-term view. Always check higher timeframes (such as daily and weekly charts) to understand the broader trend. A short-term downtrend may be a correction within a larger uptrend.
* Fundamental Analysis: Are there any upcoming news, partnerships, or developments for #LOKA that could impact its price? Technical analysis alone is not always sufficient.
* Support Levels: Identify potential strong support levels where the price might find a bottom and bounce back. The lowest price in the past 24 hours at $0.0486 is the immediate support to watch.
* Risk Management: If you decide to trade, always use stop-loss orders to limit potential losses.
In summary, the chart indicates caution. It is generally advisable to wait for a bullish reversal signal or until the price stabilizes at a strong support level before considering a purchase. If you currently hold #LOKA, you may want to reassess your risk tolerance and the likelihood of further decline.
#Gate VIP New Upgrade#
#Nonfarm Payrolls Update#