
Most traders look at charts every day, but very few actually read them.
Chart reading is not about loading indicators — it’s about understanding how price behaves, where traders react, and why moves happen.
This guide breaks chart reading down step by step, from basics to practical execution.
Step 1: Understand What a Chart Really Shows
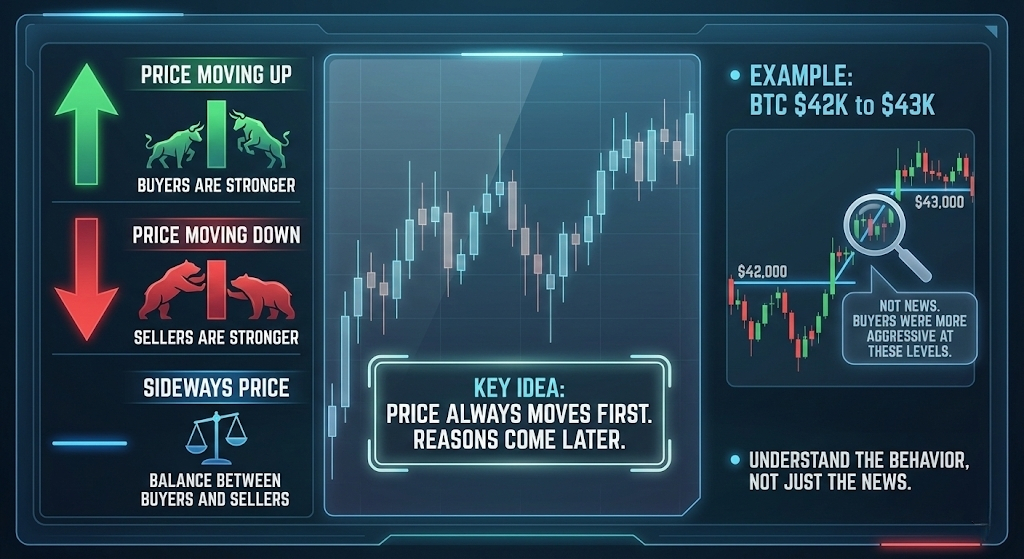
A price chart is simply a record of buyer and seller behavior over time.
Price moving up = buyers are stronger
Price moving down = sellers are stronger
Sideways price = balance between buyers and sellers
📌 Example:
If BTC moves from $42,000 to $43,000, it doesn’t mean news caused it.
It means buyers were more aggressive than sellers at those levels.
👉 Key idea: Price always moves first. Reasons come later.
Step 2: Learn Candlestick Structure (Body & Wicks)
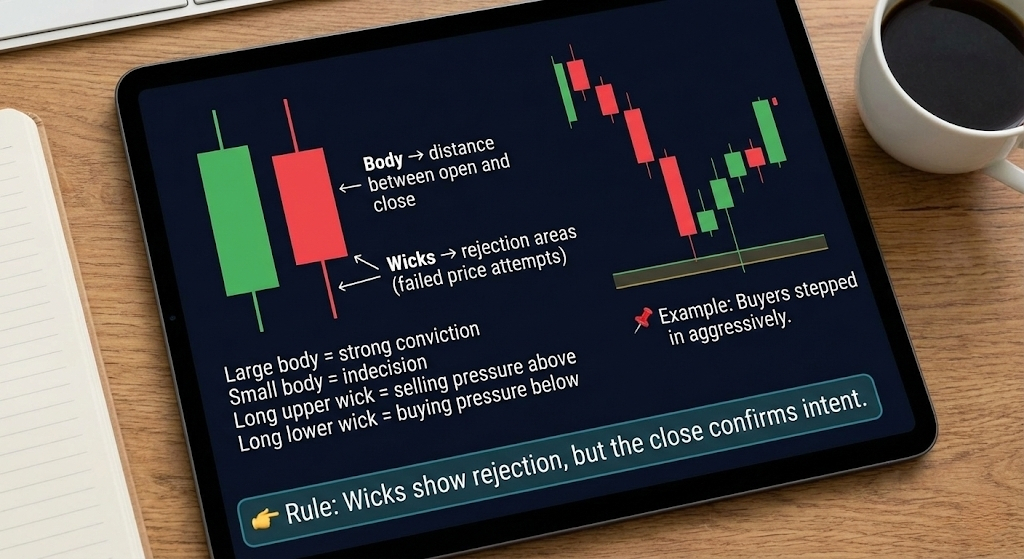
Each candle tells a short story.
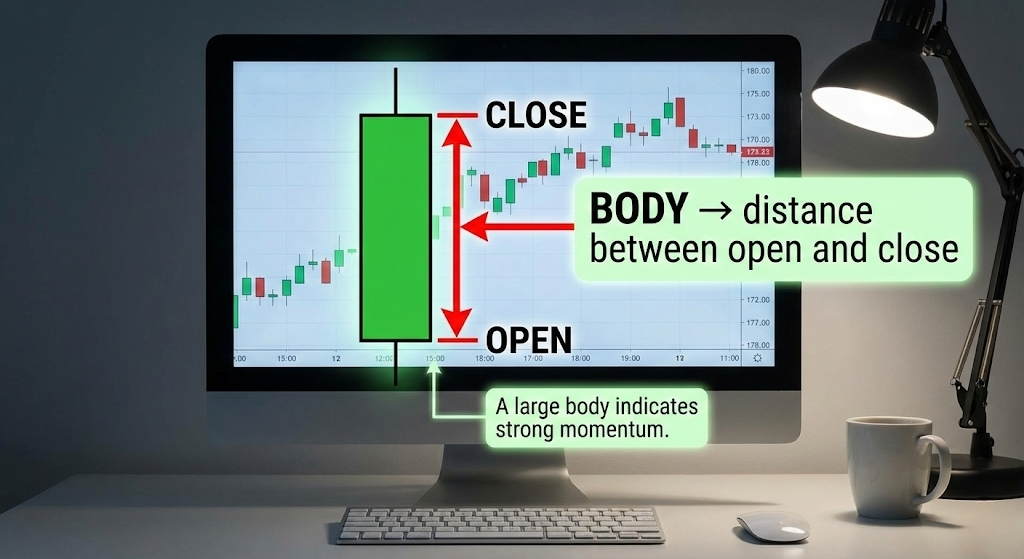
Body → distance between open and close
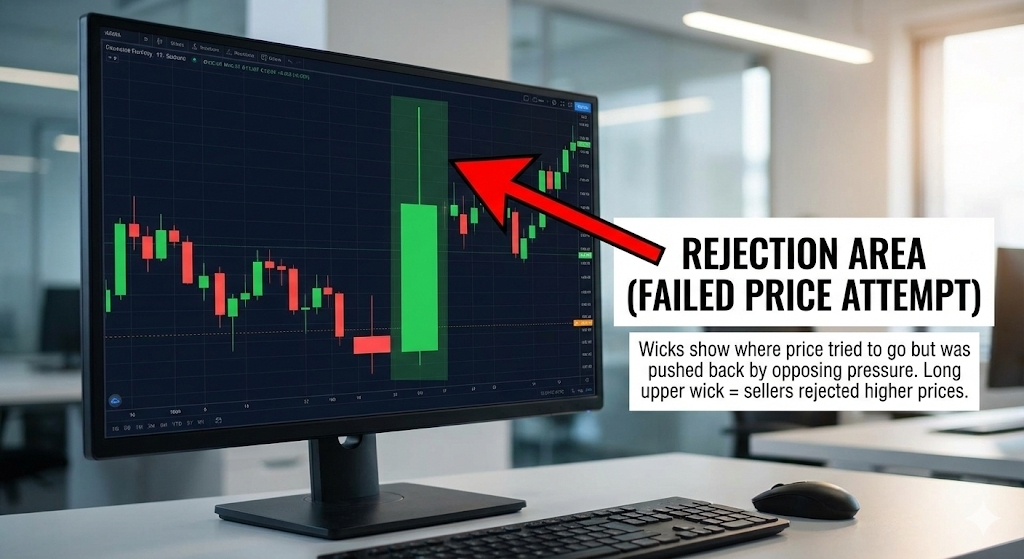
Wicks → rejection areas (failed price attempts)
How to read it:
Large body = strong conviction
Small body = indecision
Long upper wick = selling pressure above
Long lower wick = buying pressure below
📌 Example:
Price drops to support, forms a long lower wick, and closes higher → buyers stepped in aggressively.
👉 Rule: Wicks show rejection, but the close confirms intent.
Step 3: Choose the Right Timeframe
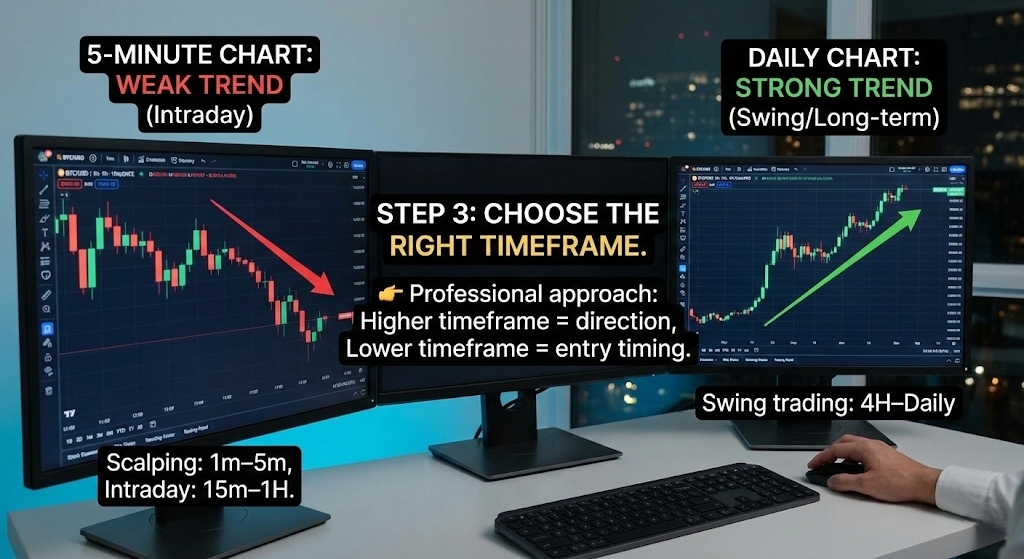
Wrong timeframe = wrong conclusions.
Scalping: 1m–5m
Intraday: 15m–1H
Swing trading: 4H–Daily
📌 Example:
On the 5-minute chart, price looks weak.
On the daily chart, the trend is still strong.
👉 Professional approach:
Higher timeframe = direction
Lower timeframe = entry timing
Step 4: Identify the Trend Correctly
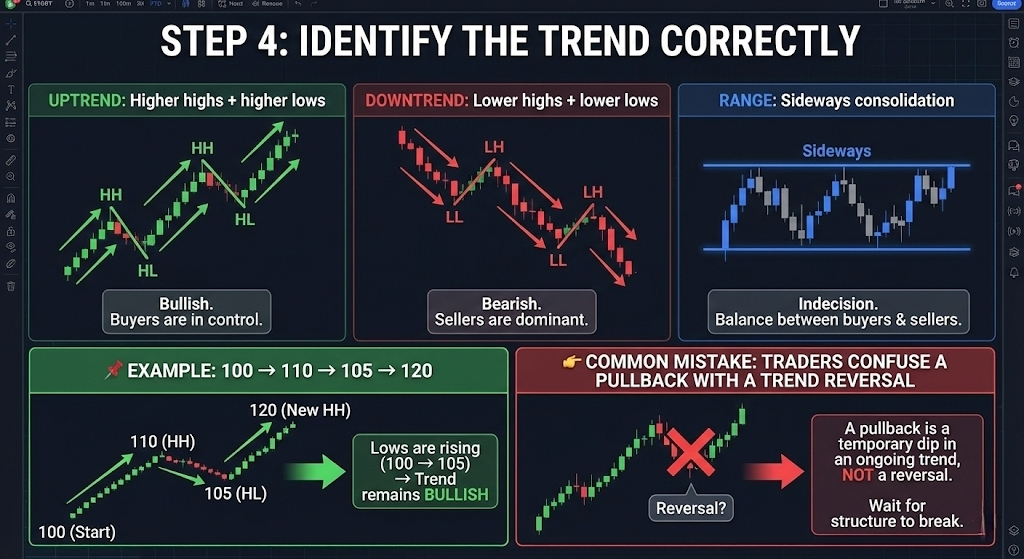
There are only three market states:
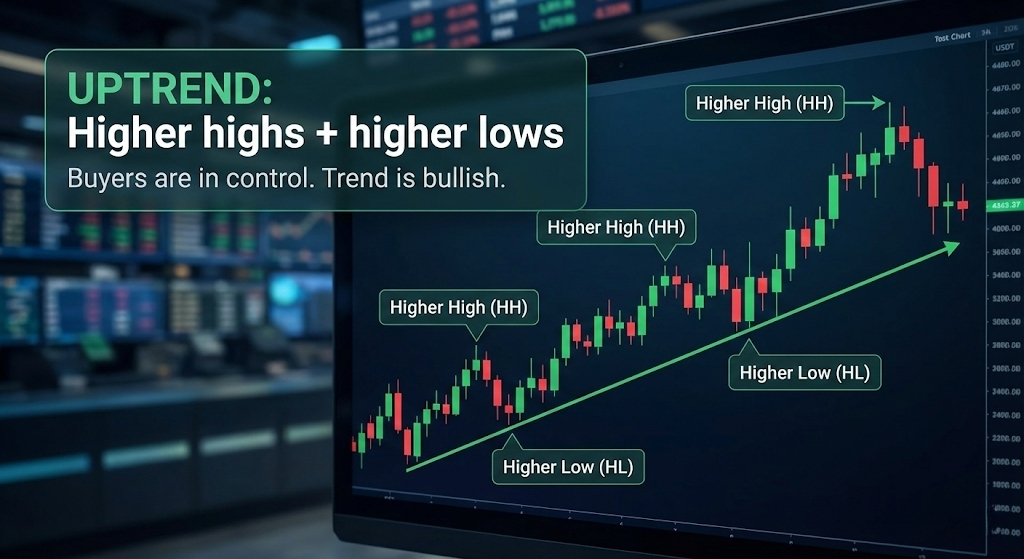
Uptrend: Higher highs + higher lows
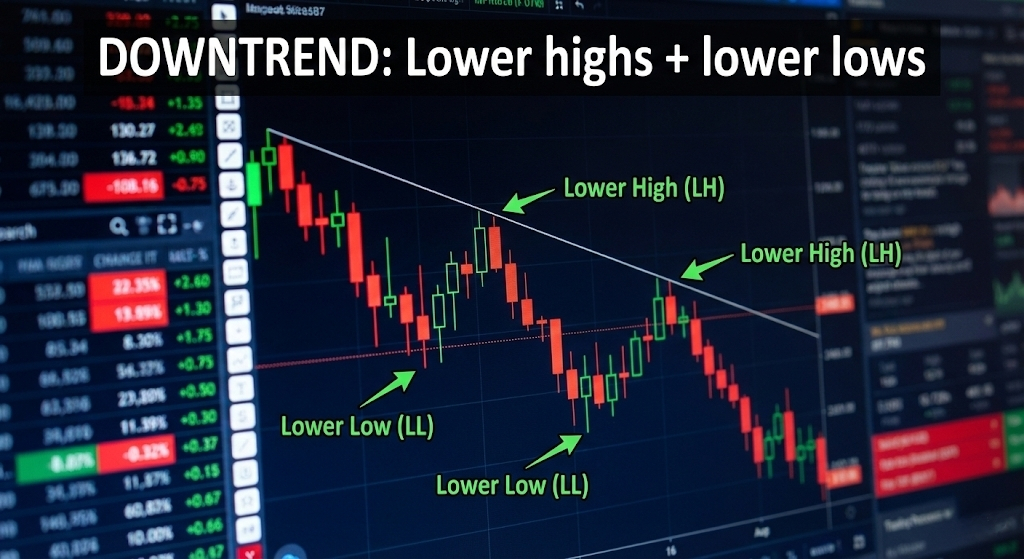
Downtrend: Lower highs + lower lows
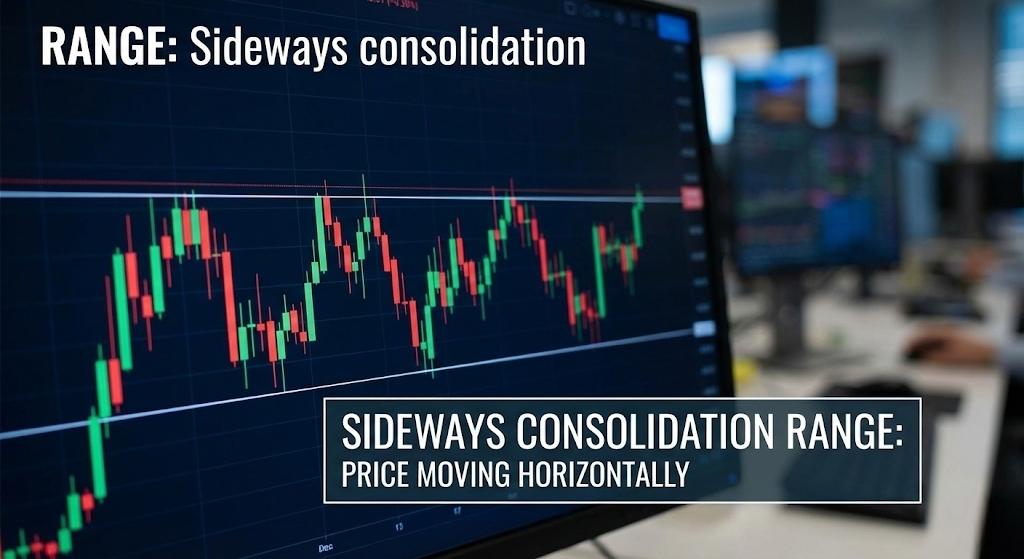
Range: Sideways consolidation
📌 Example:
Price: 100 → 110 → 105 → 120
Lows are rising → trend remains bullish.
👉 Common mistake:
Traders confuse a pullback with a trend reversal.
Step 5: Draw Support & Resistance as Zones
Support and resistance are areas, not perfect lines.
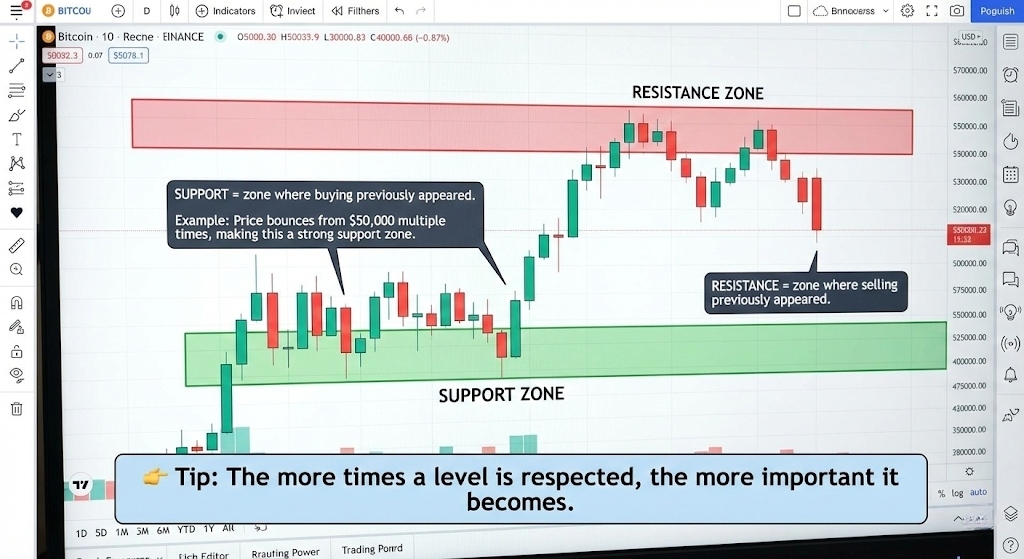
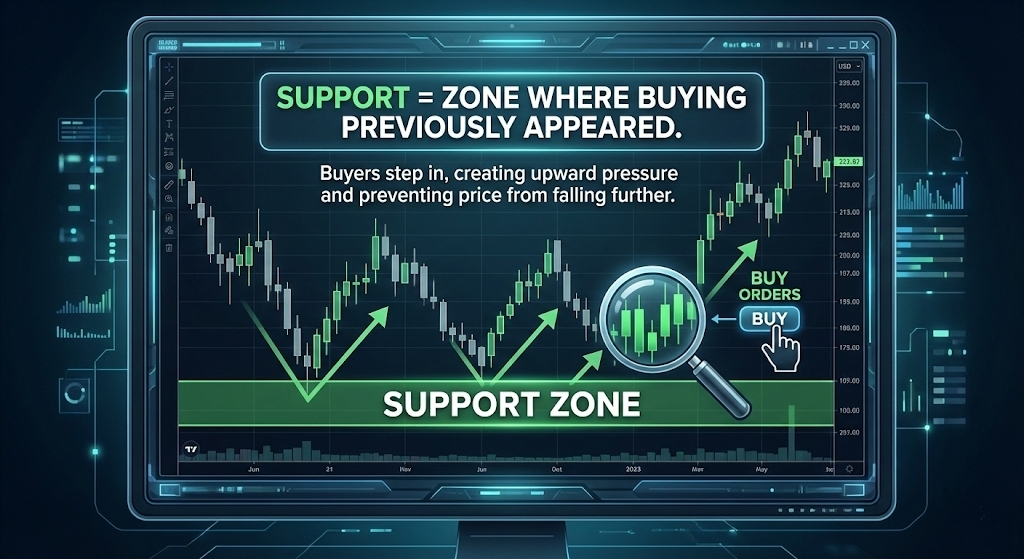
Support = zone where buying previously appeared
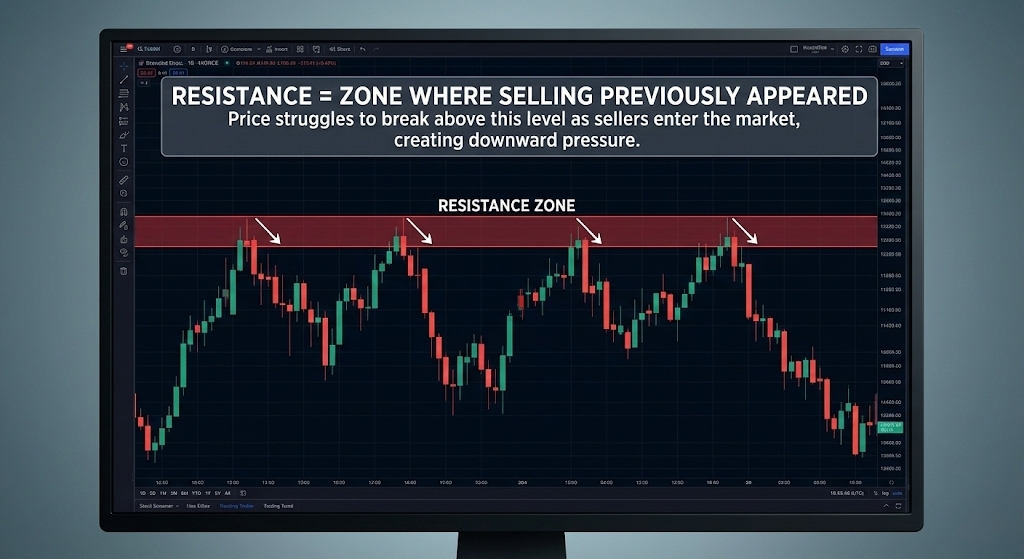
Resistance = zone where selling previously appeared
📌 Example:
If price bounces from $50,000 multiple times,
that area becomes a strong support zone.
👉 Tip: The more times a level is respected, the more important it becomes.
Step 6: Understand Breakouts vs Fake Breakouts
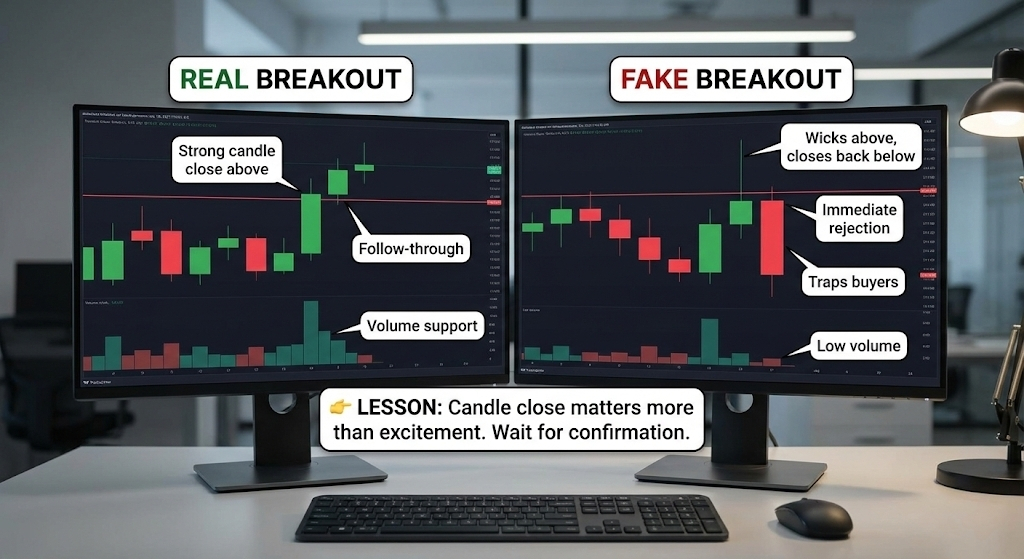
Real breakout:
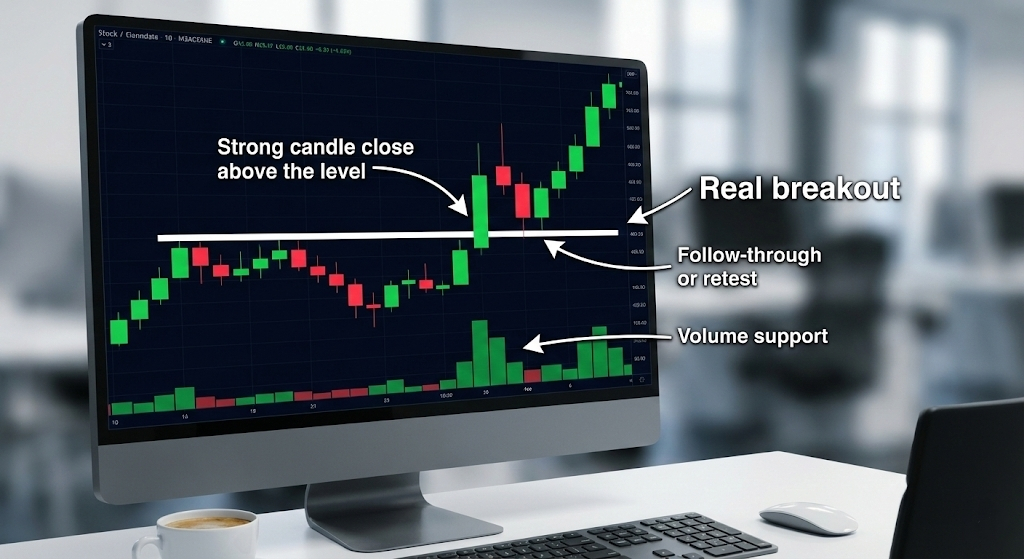
Strong candle close above the level
Follow-through or retest
Volume support
Fake breakout:
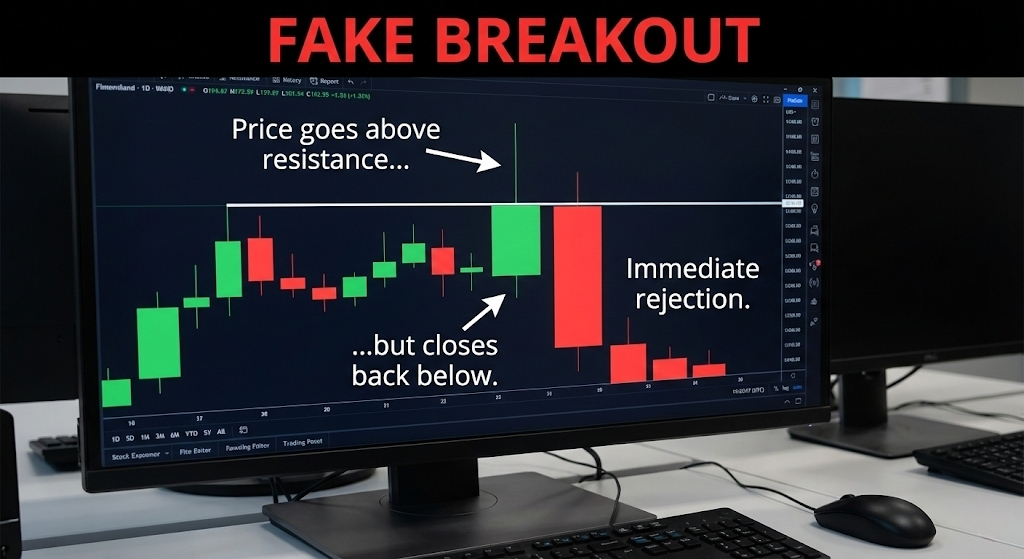
Price goes above resistance but closes back below
Immediate rejection
📌 Example:
Price wicks above resistance, traps buyers, then dumps — that’s a fake breakout.
👉 Lesson: Candle close matters more than excitement.
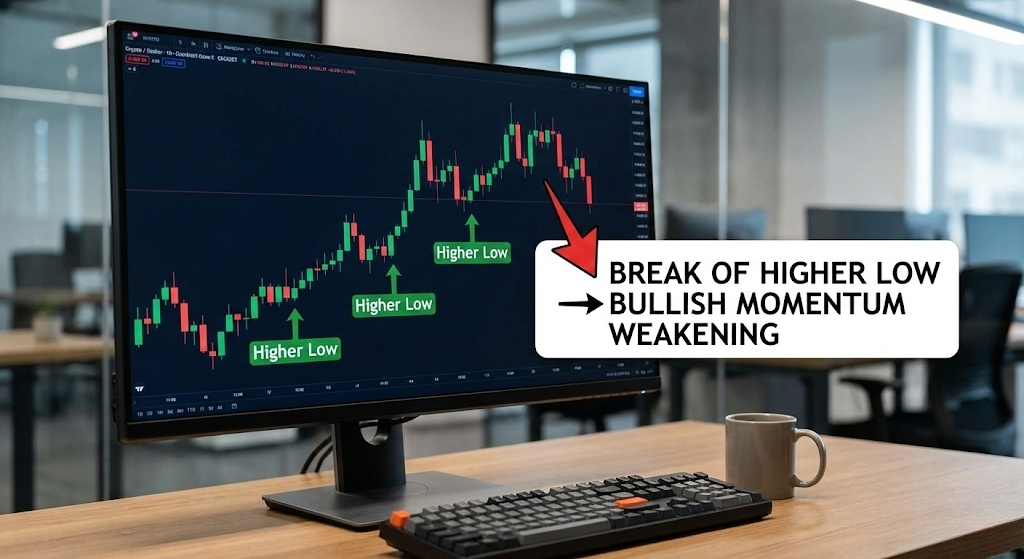
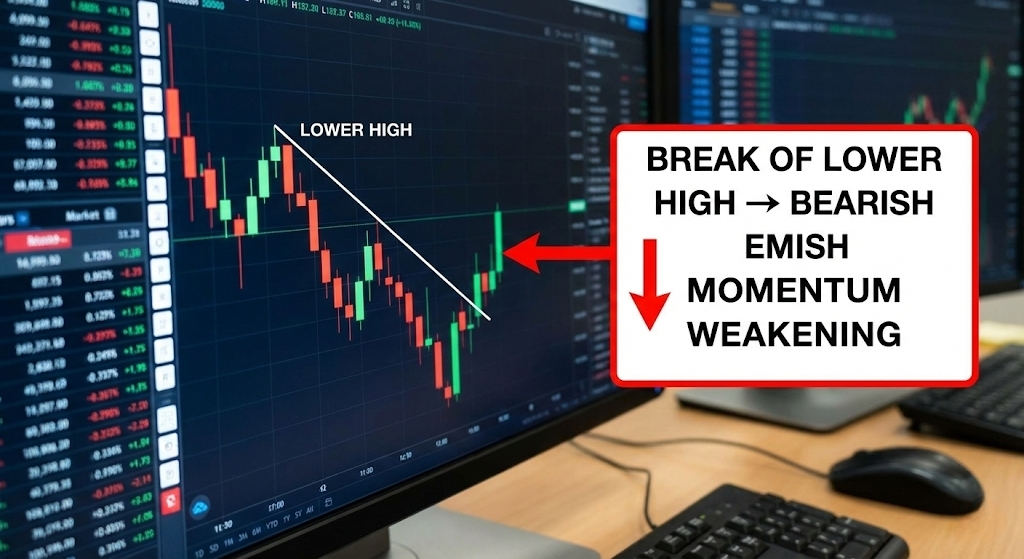
Step 7: Read Market Structure
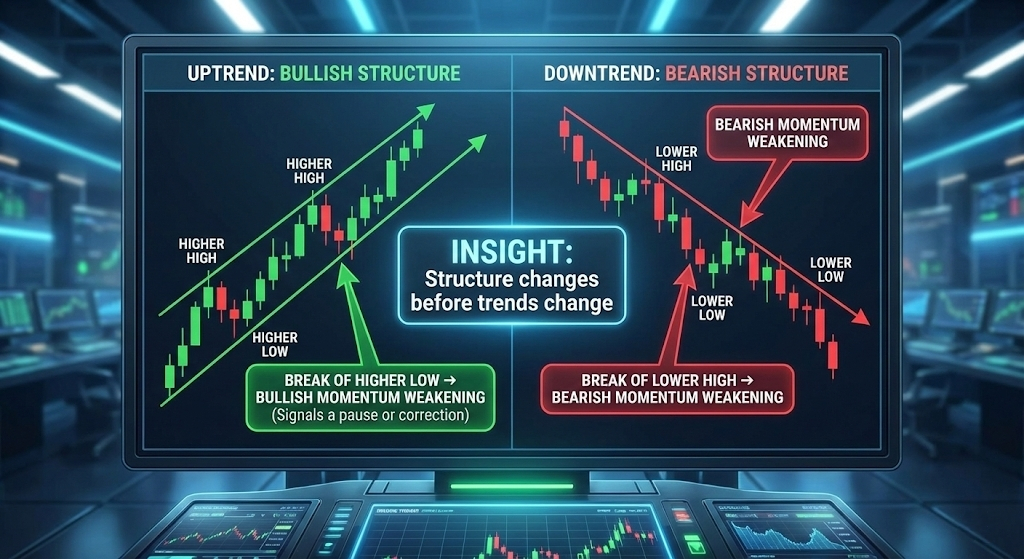
Market structure tells you whether strength or weakness is developing.
Break of higher low → bullish momentum weakening
Break of lower high → bearish momentum weakening
📌 Example:
In an uptrend, the first broken higher low often signals a pause or correction.
👉 Insight: Structure changes before trends change.
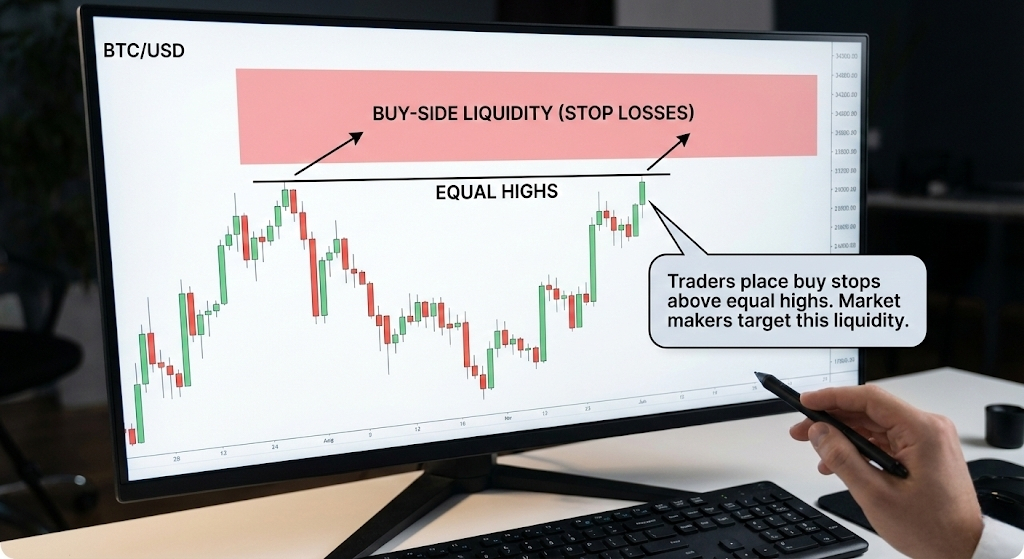
Step 8: Understand Liquidity & Stop Zones
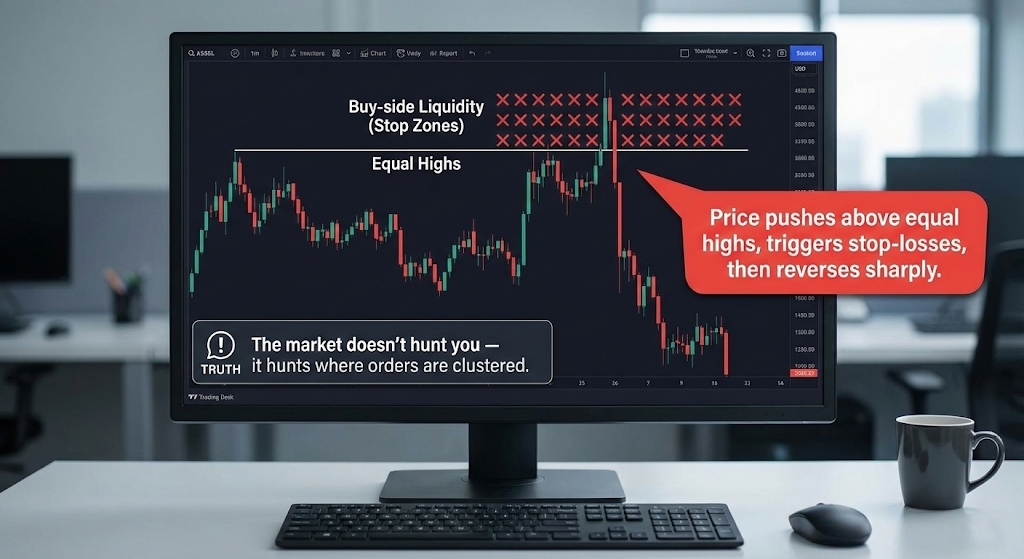
Markets are drawn to liquidity, not emotions.
Equal highs = buy-side liquidity
Equal lows = sell-side liquidity
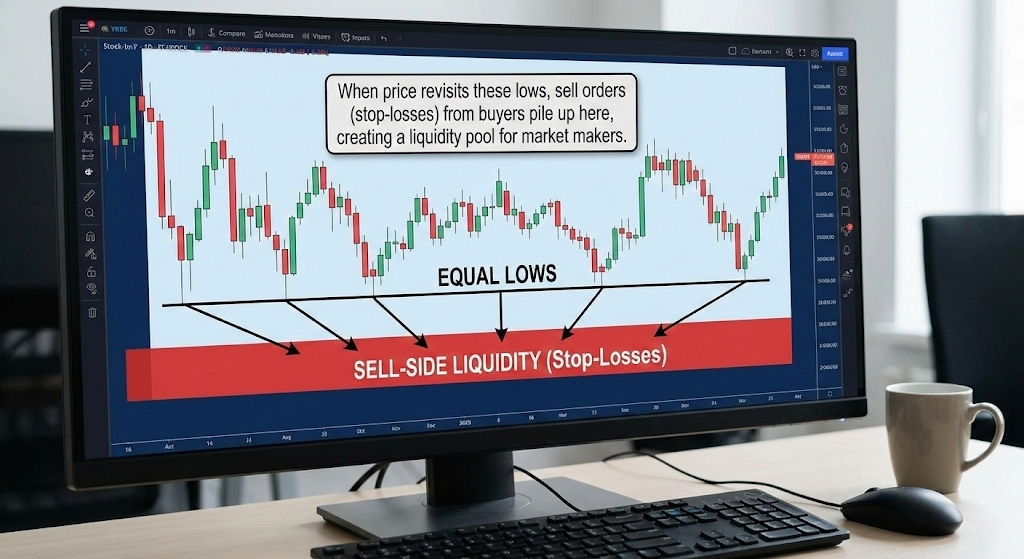
📌 Example:
Price pushes above equal highs, triggers stop-losses, then reverses sharply.
👉 Truth:
The market doesn’t hunt you — it hunts where orders are clustered.
Step 9: Use Indicators as Confirmation Only
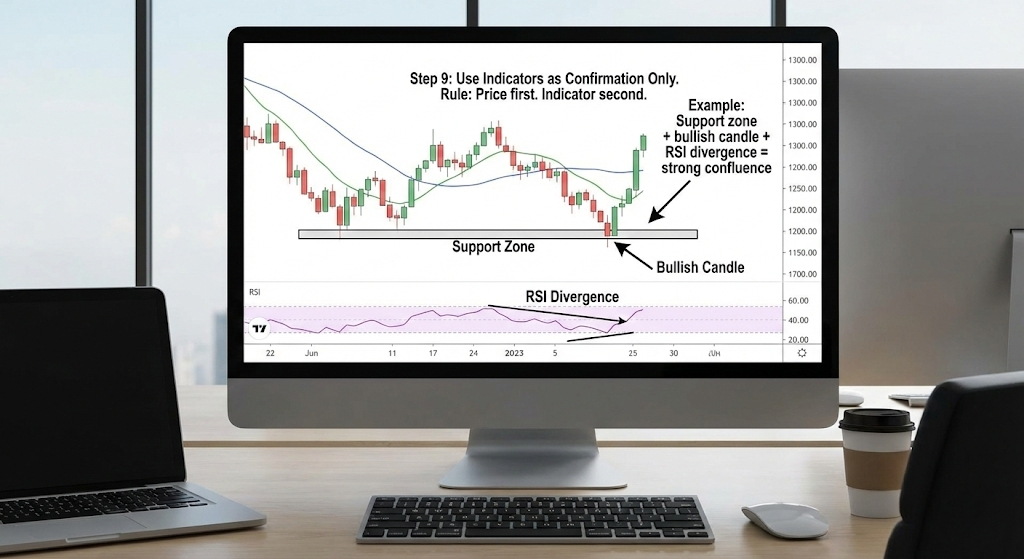
Indicators should support price — not replace it.
RSI → momentum context
Moving averages → trend guidance
📌 Example:
Support zone + bullish candle + RSI divergence = strong confluence.
👉 Rule: Price first. Indicator second.
Step 10: Build Skill Through Observation
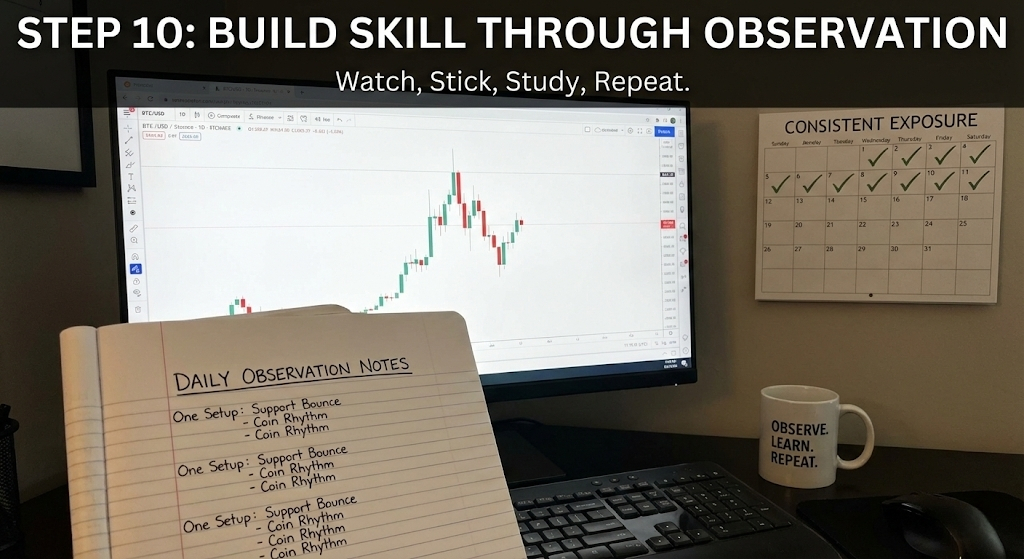
Chart reading improves through consistent exposure, not shortcuts.
Watch the same asset daily
Stick to one timeframe
Study one setup repeatedly
📌 Example:
Following one coin daily teaches you its rhythm and behavior.
Final Thoughts
Chart reading is not about predicting the future.
It’s about understanding probability and reacting logically.
✔ Clean charts
✔ Simple rules
✔ Patient execution
Good traders change indicators.
Great traders understand price.