

null
In the past few days of Bitcoin stabilization, altcoin season has seen a long-awaited dramatic fluctuation.
Tokens with a circulating market value of less than twenty million dollars have tripled or quintupled in just a few days, with some approaching tenfold increases. There have been no major developments, no ecological breakthroughs, and no new institutions entering the market; prices have simply been pushed up.
This phenomenon has an existing explanation: altcoins are high Beta assets; when Bitcoin rises, altcoins run even faster. This statement is statistically valid, but it doesn't explain everything. High Beta can explain why altcoins rise more than Bitcoin, but it cannot account for increases that are dozens of times greater. This multiple comes from another factor.
The current altcoin season index is 34, and BTC dominance is 58.5%. Both numbers tell you that this market is still quite far from a true altcoin season. However, in this market without an altcoin season, certain tokens are moving at levels typically seen only in an altcoin season.
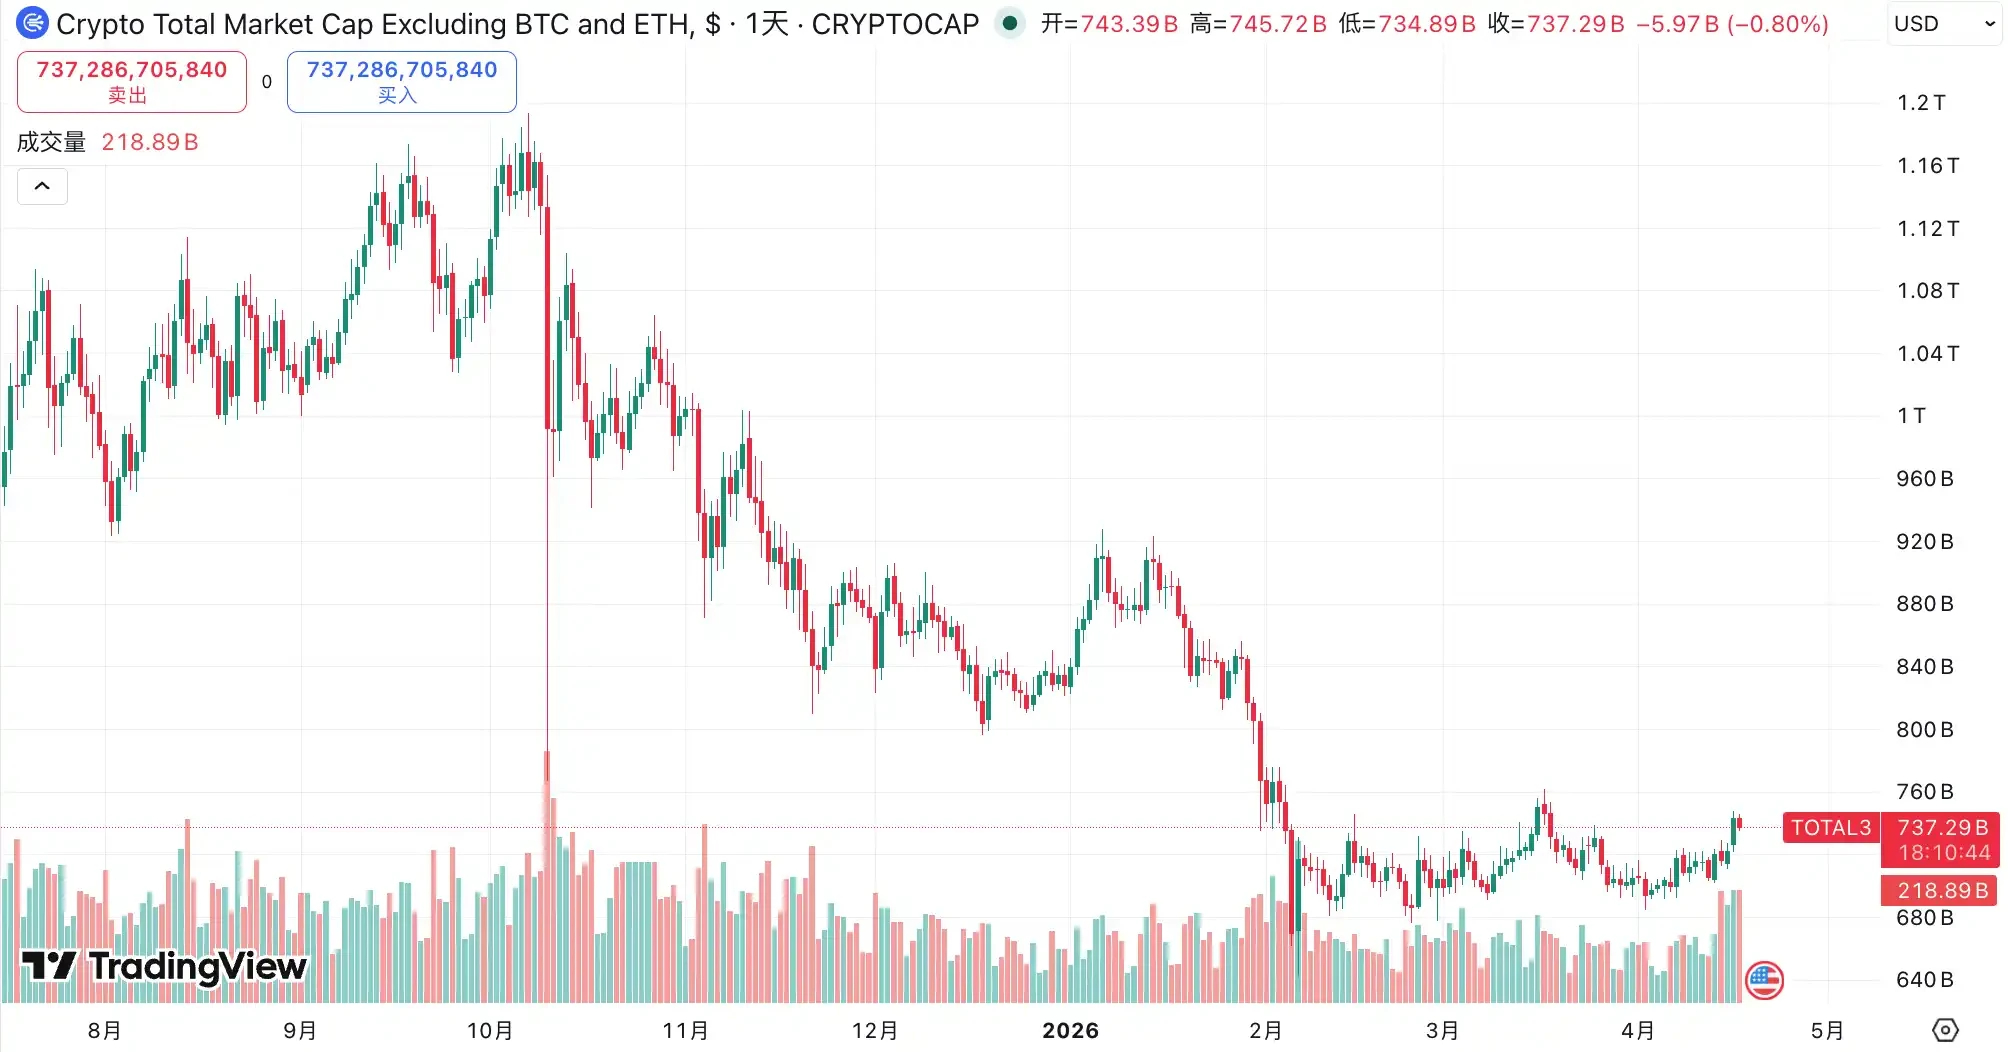
From December 2024 to April 2026, the total market capitalization of altcoins excluding Bitcoin and Ethereum shrank from about $1.16 trillion to about $700 billion, evaporating nearly 40%. When the market cap shrinks to a sufficiently low level, the rules of the game change; prices are no longer determined by market consensus but by who holds enough chips.
This is a loophole created by severe drops, not a signal emitted by a bull market.
Altcoins have indeed dropped too much.
In the blockchain field, there is the concept of a 51% attack, where controlling over half of the network's computing power allows alteration of records, double spending of tokens, and rewriting history. The capital version of this logic is simpler; it does not require technology, nor computing power, just money. In this round, the altcoin market has evaporated nearly 40% of its market value, also lowering the entry threshold by 40%.
As of early April 2026, the total market capitalization of altcoins is approximately $700 billion, down about 40% from the peak of about $1.16 trillion in December 2024. If we take the end of 2025 as the cutoff, the decline is around 44%. The two metrics measure different time points but the direction is the same: the overall size of this market has nearly been cut in half.
What does a halved market cap mean? Ten million dollars in a market with a circulating market cap of five hundred million dollars accounts for 2% of the circulation, while in a market with a circulating market cap of fifty million dollars, it accounts for 20%. The threshold has been lowered tenfold, but the amount of money hasn’t changed. After a severe drop, the cost of controlling the market becomes calculable. If it can be calculated, it can be executed.
The recent explosive rise of the SIREN token provides an analytical case. In late March, SIREN experienced a rapid rise, leading to a notable surge. On March 24, on-chain analyst EmberCN issued a warning: an entity might control up to 88% of SIREN's circulating supply, equating to about $1.8 billion at that time. As the news spread, SIREN dropped from $2.56 to $0.79 on the same day, a decline of over 70%. During the rapid price escape, almost no one could exit at a reasonable price because that price was never formed by the market.
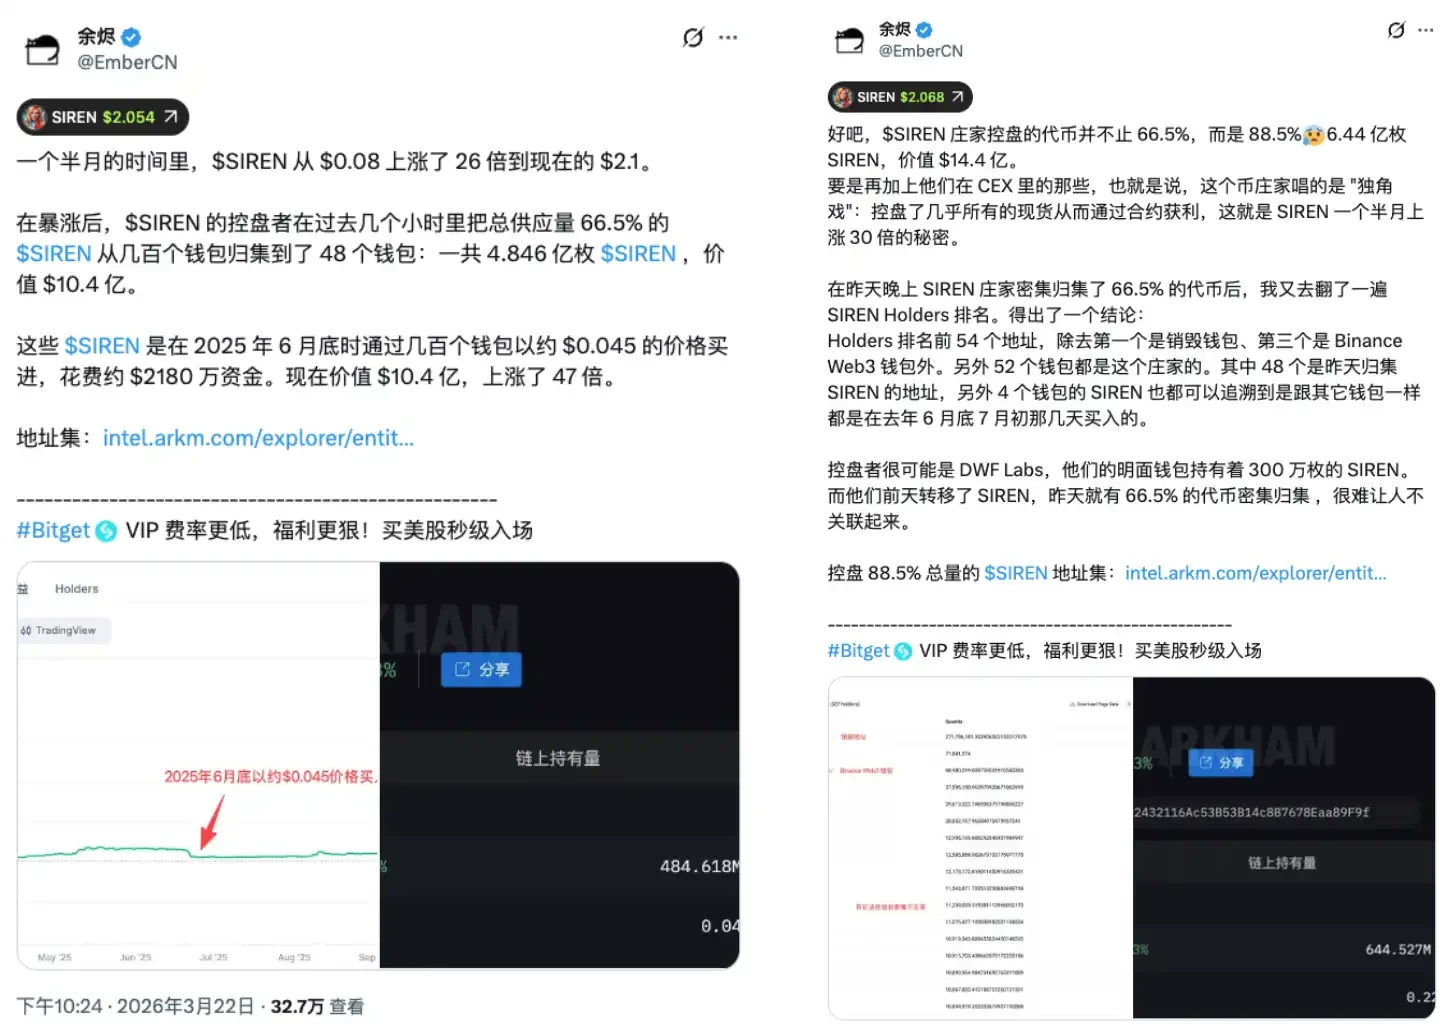
Conservatively estimating, 48 wallets hold approximately 66.5% of the circulating tokens. Even by this minimum measure, a very limited set of addresses already possesses the structural conditions to control the price direction. From the moment the price is formed, the symmetry of this game has already been broken. Retail investors, thinking they are participating in free market transactions, have entered a container with a pre-set exit path.
SIREN is not an isolated case nor a black swan; it is the norm for severely undervalued altcoins structurally. The deeper the drop, the less money is needed, and the easier it is to be hijacked. A severe drop is not a discount but a vulnerability, and this round of overall market cap decline of 40% means that this vulnerability has systematically expanded across the entire market.
Shorts are fuel.
If the story only had this half, the logic would be one-sided: the operator locks up chips, raises prices to sell, and retail investors take over, leading to a crash. However, the market for ultra-small-cap altcoins usually has another layer of structure on top of it, where shorts become the ignition material.
During the rapid price surge of SIREN, the funding rate reached -0.2989% every 8 hours, annualized at about -328%. To translate, shorting SIREN while holding a position means paying approximately 0.3% in funding fees to the longs every 8 hours. Holding the position for a month, this fee can consume over 25% of the principal, not even accounting for the paper losses from price increases.
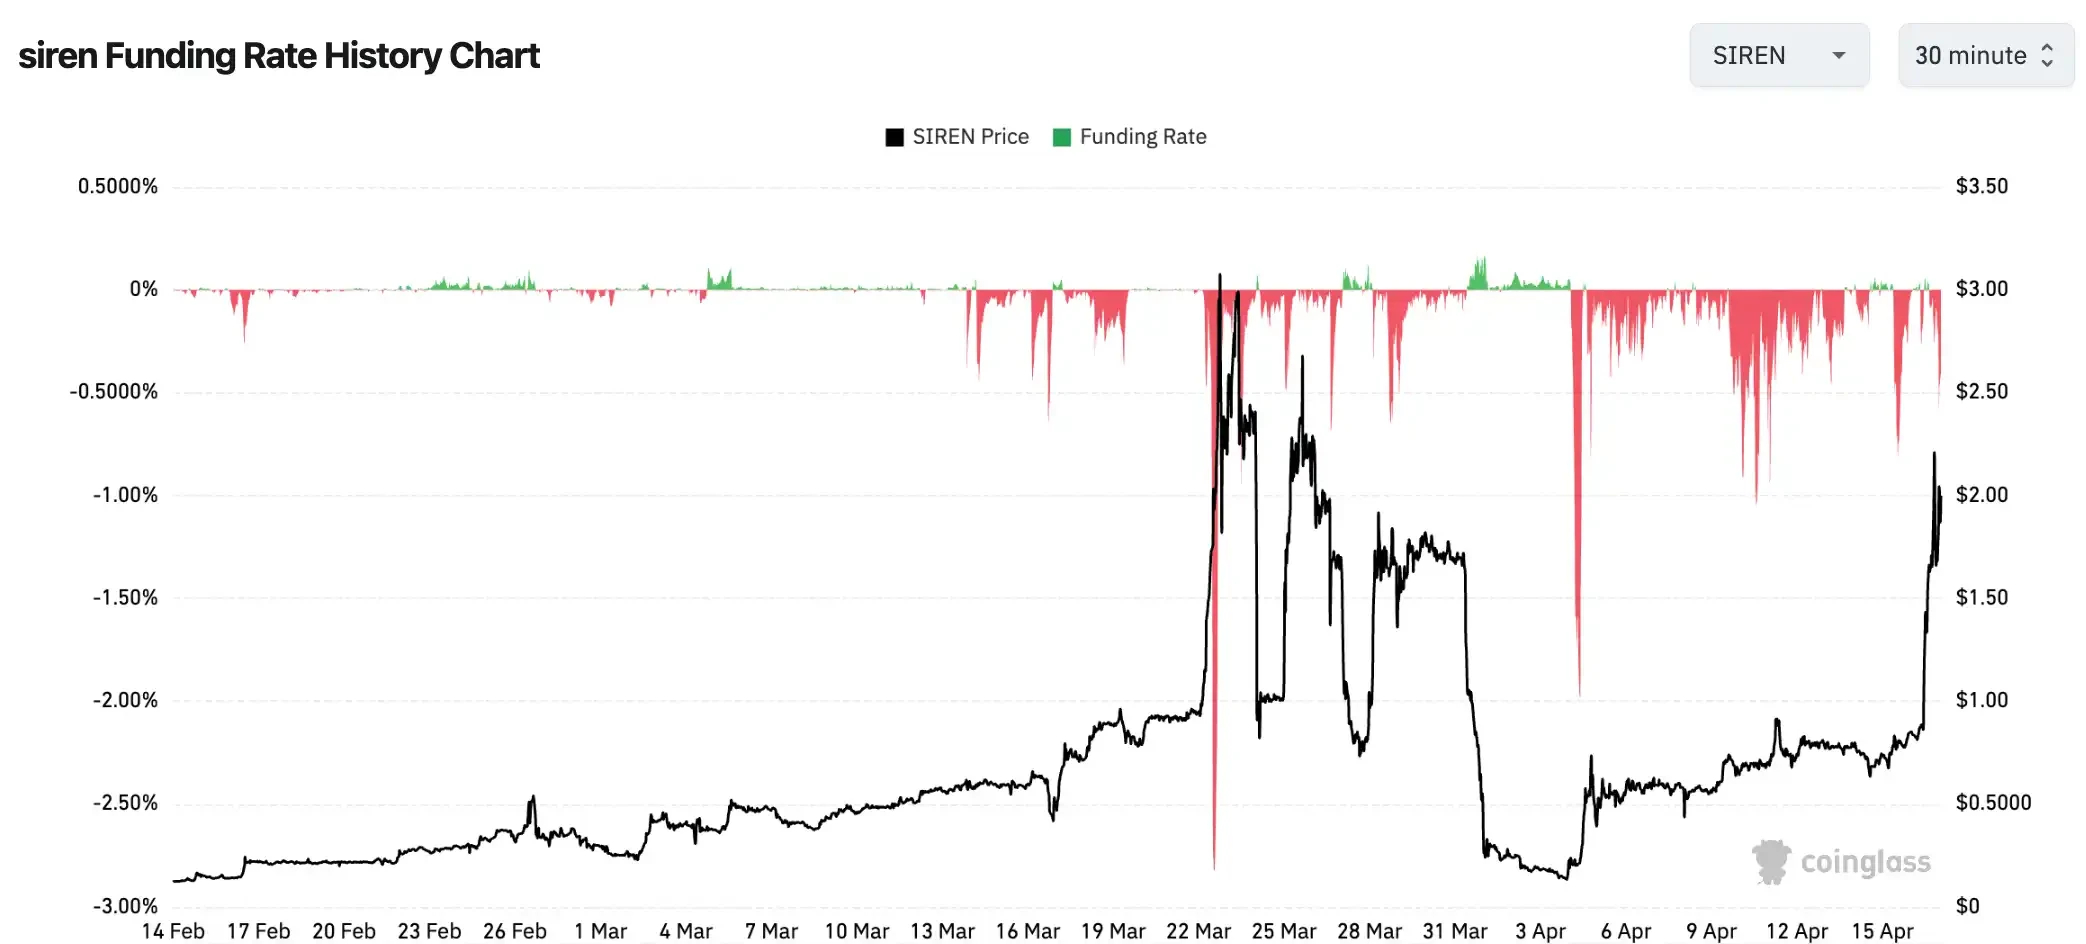
This number is not uncommon in the small-cap altcoin market. Some tokens have seen funding rates drop to as low as -0.4579% every 8 hours during extreme market conditions, annualized at about -501%. At this level, short sellers face not just the risk of a wrong directional judgment, but the certainty of being slowly ground down by a machine. Even if the final direction is correct, they may be exhausted before the right day arrives.
When you see an altcoin rise by 80% and decide to short it waiting for a pullback, every short position you take pays an interest to the longs on the other side. Meanwhile, if the price continues to rise and hits your liquidation line, the system will automatically buy at market price to close your position, forcing that buy to further push up the price.
The chain of short squeezes operates like this. Prices rise, short sellers incur paper losses, and when these losses hit the margin call line, the system automatically buys to close positions at market price, pushing prices even higher. More shorts are triggered, leading to a new round of buying. In the illiquid small-cap market, each order can cause larger price movements, and the efficiency of this chain reaction is much higher than in large-cap assets.
There is an often-overlooked asymmetry here. Seeing a token soar 90% and deciding to short it, one typically believes they are making a probability-based correct judgment: 'After such a rise, there must be a pullback.' But in a market with highly concentrated holdings, this judgment must contend not only with price direction but also with a funding cost of 0.3% leaving the principal every 8 hours, and the chain reaction triggered by passive buys once the liquidation line is hit. This game has never been symmetric from the start.
Extreme negative funding rates are the dashboard readings of this machine. Shorts have been fully loaded, and with ammunition ready, accelerating now means the opposing group only has two choices: get liquidated and exit, or chase the price higher. Both choices are fueling the price. This is not a rise formed by market consensus; it is a one-sided consumption designed by structure.
A bustling market without new money.
The weekly DEX trading volume on the BSC chain has increased by 97% year-on-year, the altcoin season index is 34/100, and BTC dominance is 58.5%. These three numbers can coexist while also being contradictory.
The on-chain heat is indeed palpable, but the latter two numbers tell you that this market is still in 'Bitcoin season.' Less than half of mainstream altcoins have outperformed Bitcoin, and dominant funds are highly concentrated in Bitcoin, far from spreading out. But these three numbers also point to the same reality: this is stock funds accelerating their circulation, not new money entering. The excitement is real, but excitement does not equal expansion.
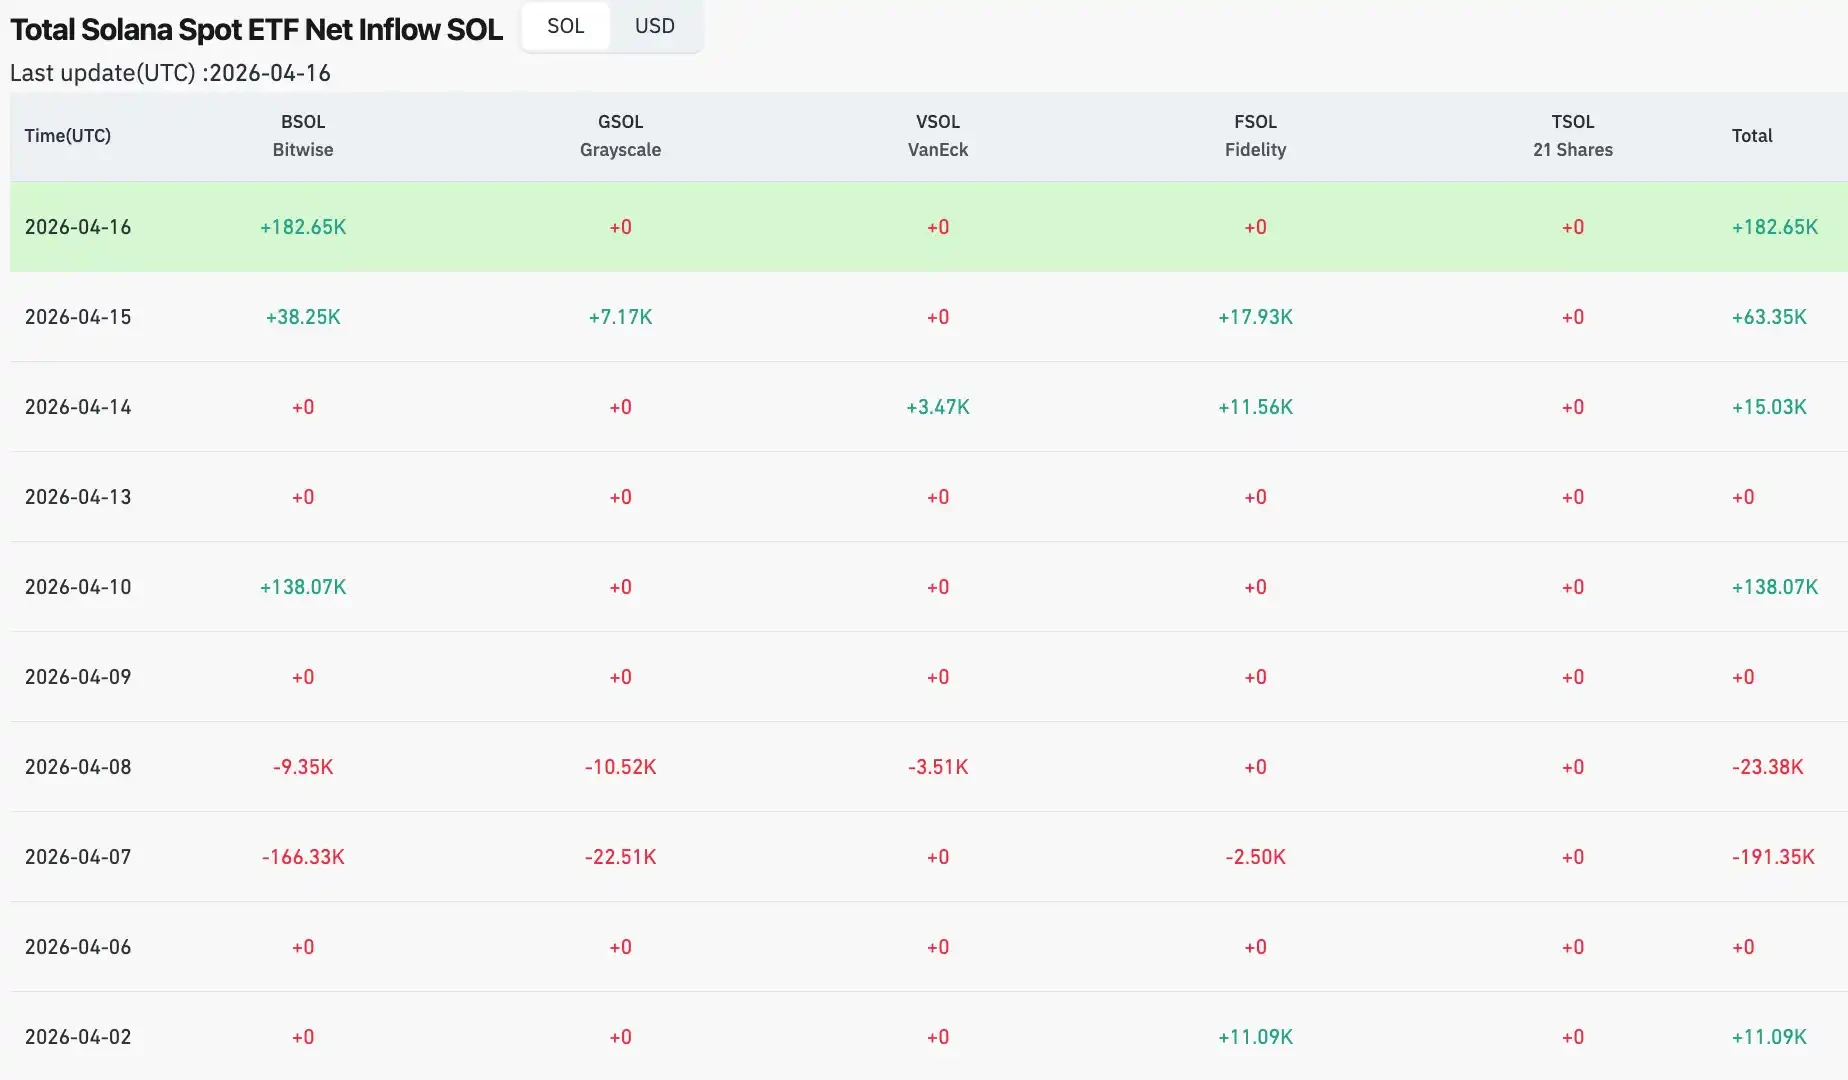
The movement of institutional funds provides evidence. In early April, the daily net inflow of the Solana ETF fell to zero, having recorded a net outflow of $6.2 million on March 30. The XRP ETF continued to see net outflows at the beginning of the month, with only about $64,600 in micro inflows on April 2. Although the Ethereum ETF saw a single-day net inflow of $120 million on April 6, it had already seen a prior outflow of $71 million the day before. The overall pattern of institutional funds in the altcoin direction is one of waiting, not rotation.
Compared to the real altcoin season in 2021, the difference is structural. That round saw BTC dominance drop from over 70% to below 40% from early in the year until May, reaching a low of about 39%. The rotation of funds between Bitcoin and altcoins was clearly visible, and the altcoin season index once exceeded 90. That was a comprehensive expansion driven by macro liquidity flooding, with the residual warmth of DeFi summer still present, and retail FOMO entering massively, with stablecoin issuance rapidly expanding in the same period, continuously injecting incremental funds into the entire ecosystem. Today's scores of 34 and 58.5% reflect a different picture: the engine is just warming up, far from full-speed operation.
There is also a variable unique to this cycle. Institutional funds entering the market through ETFs follow the internal logic of asset allocation, not the emotional logic of the crypto market. Institutions are adjusting their 'Bitcoin allocation to X%', not 'the altcoin season is coming, let's increase altcoin holdings.' This batch of funds structurally will not spontaneously rotate into the altcoin market unless a clear directive is given. This is the fundamental structural difference between 2021 and 2026; the money that entered in 2021 contained a large amount of retail funds that followed the 'where it's hot, go there' logic, while today institutional money is anchor-based, with fixed paths that do not drift with market sentiment.
The on-chain trading volume's increase of 97% is real, but a market without new money is a zero-sum game. Every winner's profit corresponds to another player's loss; the total amount in the pool does not increase. Stock games may not necessarily collapse, but they determine the structure of this game. The excitement belongs to those who are already in the game and have chips. Those who come in later are usually just using their money to complete the last mile of someone else's selling.
Epilogue.
Returning to the initial data set, Bitcoin rose by about 0.85% over four days, while certain small-cap tokens surged several times in the same period. Now you have a framework. The rise of Bitcoin is one thing; the macro environment is taking a breath, institutional funds are testing the waters, and the market is waiting for the next clear signal. The explosive rise of altcoins is another matter; the structural loopholes created by low market cap after severe drops enable a small amount of capital to leverage prices in a thin liquidity container, and extreme negative funding rates turn shorts into fuel for longs. Both events occurring simultaneously does not mean they are telling the same story.
The altcoin season index is 34, and BTC dominance is 58.5%. By the historical standards of 2021, this machine hasn't even finished its warm-up procedure. BTC dominance needs to drop from 58% to about 39% as it did that year, institutional capital needs to expand from 'Bitcoin allocation' to 'crypto asset portfolio allocation', and incremental capital needs to continue flowing in rather than cashing out at highs; none of these issues can be solved by a single limit-up.
There are two types of people in this machine: one type knows who it operates for, and the other type is the fuel it requires to operate.
The rise of BTC is a signal, while the explosive rise of altcoins is an echo. Distinguishing these two matters is essential to make a choice in this market that is not predetermined by machines.