
Bitcoin is struggling to regain the $107,500 and $108,000 levels. If it can successfully break through the key resistance level of $109,500, it may open up further upward potential.
After experiencing a pullback, the price of Bitcoin rebounded above $108,000. However, the price is still below $109,000 and the 100-hour simple moving average. From a technical chart perspective, the BTC/USD hourly chart has formed a short-term descending channel, with resistance located near $108,800. If it can effectively break through the upper boundary of this channel, the rebound trend may continue.
Market Trend Review
The Bitcoin price has recently failed to hold the support at $109,500 again, dipping to $106,750 in search of support, and then entering a consolidation phase. After reaching a low of $106,717, the market gradually began to recover.
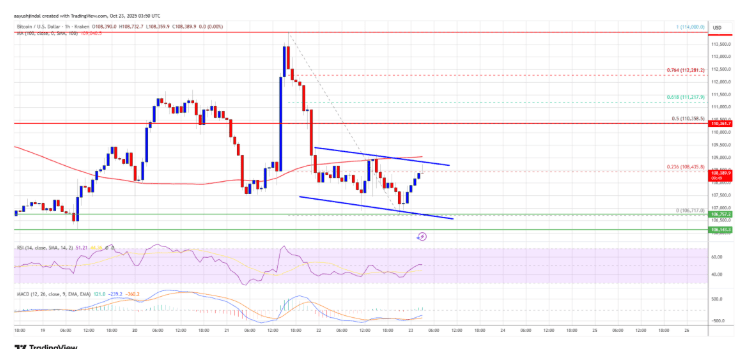
The current price has risen above $107,500 and $108,000, breaking through the 23.6% Fibonacci retracement level from the high of $114,000 to the low of $106,717. However, the upward path still faces multiple technical resistances.
Key Technical Level Analysis
Currently, Bitcoin is trading below $109,000 and the 100-hour moving average. Recent resistance is near $108,800, which coincides with the upper boundary of the short-term descending channel.
Important resistance range is concentrated around $109,500. If this area is broken, the next key resistance level will look towards $110,500, which is precisely the 50% Fibonacci retracement level of the decline from $114,000 to $106,717. If it can effectively break through $110,500, it may continue to challenge the $111,500 resistance, followed by a test of the psychological level at $112,000. Further resistance can be seen in the $113,500 area.
Downward Risk Warning
If the price fails to break through the $109,500 resistance zone, it may trigger a new round of adjustments. Recent support levels to watch are $107,200, with significant support near $106,750.
The next support defense line is at the $105,800 area; if it fails, it may test the $105,000 support. The key support level is still at $103,500; if this level is broken, the short-term rebound may be challenged.
Technical Indicator Analysis:
Hourly MACD: Although in a bearish zone, the downward momentum is weakening
Hourly RSI: Currently fluctuating around the 50 level, with relatively balanced bullish and bearish forces
Key Price Level Summary:
Main Support Levels: $108,000, $106,750
Main Resistance Levels: $109,500, $110,500
