

Cardano is registering a rebound within a descending triangle pattern on the 4-hour chart.
The open interest for ADA futures contracts is moving steadily below $700 million, following the collapse on October 10.
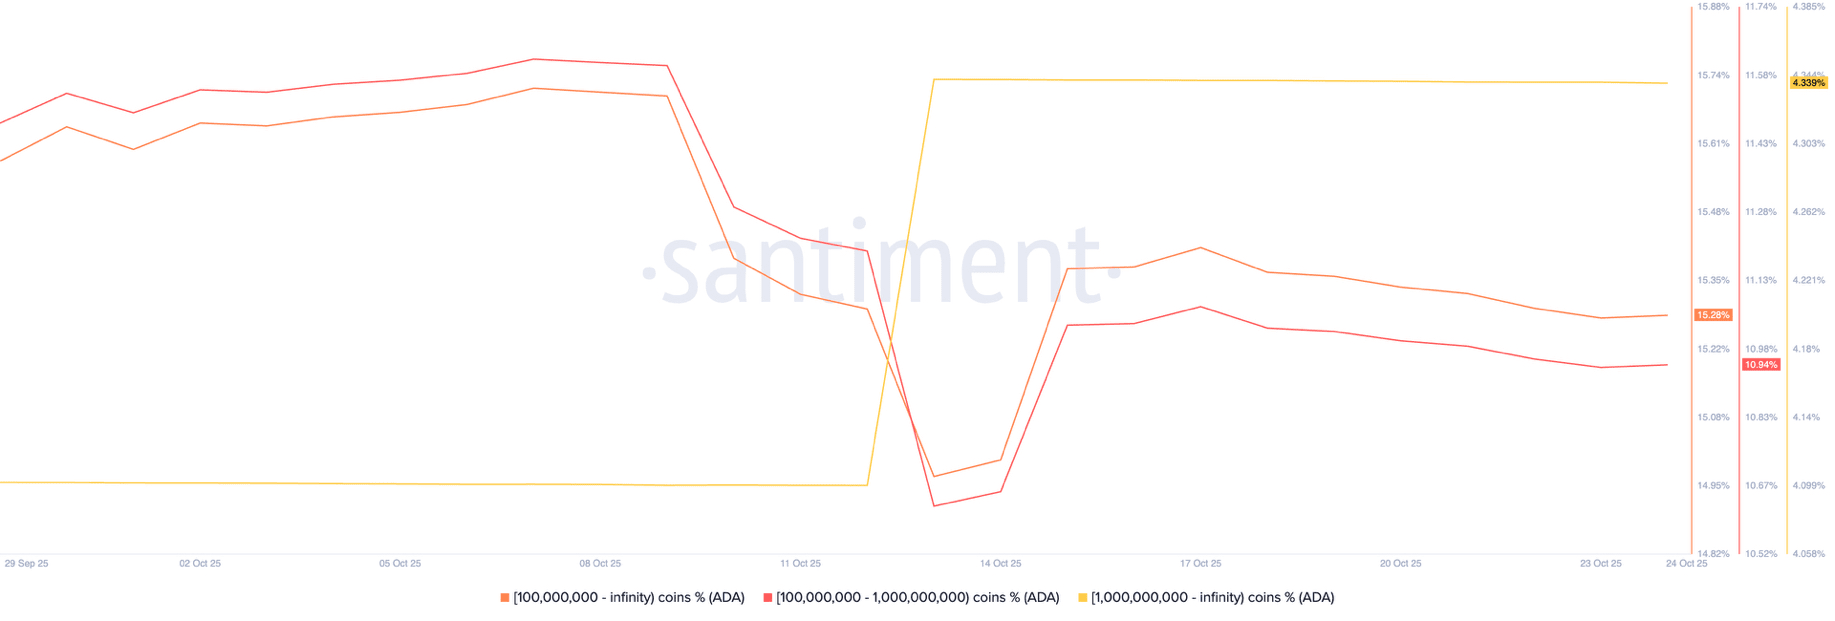
Data on the chain shows mixed sentiments among large wallet investors.
The price of Cardano ($ADA ) is up about 2% at the time of writing this report on Friday, extending its gains by 3% from Thursday. Technically, Cardano is rebounding within a descending triangle pattern on the 4-hour chart, targeting a potential breakout.
However, the spirit of ADA's bulls lacks retail support, while large wallet investors, commonly known as whales, remain divided on Cardano's fate.
Investors in Cardano on-chain and retail are giving mixed signals.
Large wallet investors, or whales, who hold more than 1 billion ADA have increased their holdings to 4.33% of the total ADA supply, up from 4.10% earlier this month. Typically, buying activity from large investors is seen as a potential bullish sign for prices.
However, whale groups holding between 100 million and 1 billion have lost confidence in Cardano, having offloaded their holdings by 56 percentage points so far this month, dominating 10.94% of the total ADA supply.

Cardano's supply distribution. Source: Santiment.
Away from chain holders, the derivatives market indicates a lack of commitment among leveraged Cardano traders. CoinGlass data shows that the open interest in ADA futures contracts (OI) stands at $660.90 million, up from $635.94 million on Thursday, and has been steadily moving below $700 million after the October 10 collapse from $1.51 billion. The stagnation in OI, the nominal value of outstanding derivatives contracts, indicates a risk-averse sentiment among traders who prefer a wait-and-see approach.
Open interest in Cardano futures contracts. Source: CoinGlass
Cardano seeks recovery with a focus on breaking the triangle pattern.
Records $ADA a bounce from a local support line, completing a descending triangle pattern on the 4-hour price chart. At the time of writing this report, ADA faces resistance at the 50-period exponential moving average at $0.6554.
If Cardano surpasses this dynamic resistance, it may challenge the upper trend line near the central pivot point at $0.6604. A decisive close above this level would confirm the pattern breakout, potentially extending the rally to the R1 pivot point at $0.7284.
Momentum indicators on the 4-hour chart point to a bullish tilt as the Moving Average Convergence Divergence (MACD) crosses above the signal line, extending the upward trend towards the zero line. The consecutive rise in green bars in the histogram following the crossover indicates an increase in bullish momentum.
Meanwhile, the Relative Strength Index (RSI) on the same chart reads 53, with its rise above the midpoint line indicating increasing buying pressure.
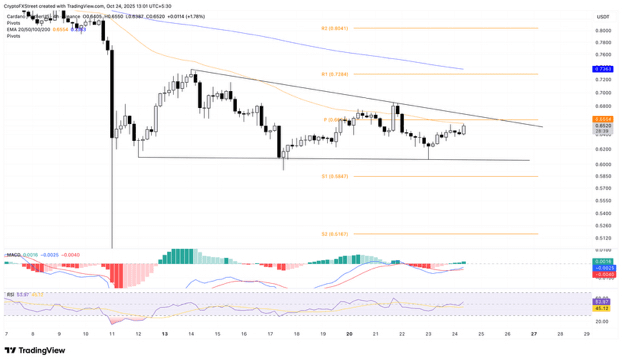
A chart of the ADA/USDT price for a 4-hour period.
However, a descending triangle pattern generally leads to a bearish breakout. If ADA closes below Wednesday's low at $0.6061, the S1 and S2 pivot points at $0.5847 and $0.5167 might act as support levels.
#ADA! #ADA.每日智能策略 #BinanceHerYerde #BinanceSquareFamily #BinanceSquare