Solana has initiated a new round of rising行情 above the 200 US dollar mark. The current price of SOL is consolidating above 200 US dollars, with expectations to challenge the resistance area of 208 US dollars in the future.
SOL has started a new round of rise against the US dollar, breaking through the levels of 188 US dollars and 195 US dollars.
Currently, the trading price of this cryptocurrency is above 200 US dollars and is above the 100-hour simple moving average.
On the hourly chart of the SOL/USD trading pair, a bullish trend line can be observed with support at 198 US dollars (data sourced from Kraken exchange).
If this trading pair can successfully break through the resistance zone of 208 US dollars, it is expected to continue the upward trend.
Solana price has regained the $200 mark.
After stabilizing around $180, Solana's price has seen a strong rebound, resembling the trends of Bitcoin and Ethereum. SOL successfully broke through $188, entering a short-term bullish range.
The coin price has further broken through the resistance level of $198. The bullish forces have pushed the price above $200. Currently, the price is consolidating its recent gains, which started from a low of $177 and reached a high of $204, with the current price having rebounded above the 23.6% Fibonacci retracement level.
Solana is currently trading above $200 and above the 100-hour simple moving average. Meanwhile, on the hourly chart of SOL/USD, a bullish trend line at $198 has formed, providing immediate support.
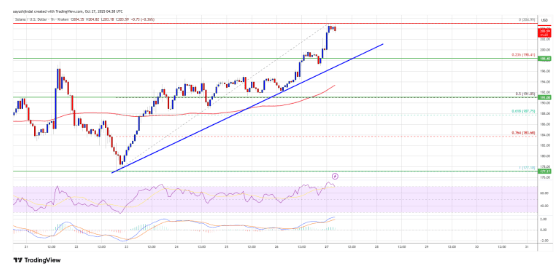
During the uptrend, the price encountered resistance near $205. The next key resistance is around $208. Major resistance is expected at around $212. If it effectively breaks through the resistance area of $212, it will create conditions for continued upward movement. The key resistance above is at $225. If it continues to rise, the price may test the $232 level.
Is SOL facing another pullback?
If SOL fails to break through the resistance level of $205, it may trigger a new round of pullback. The initial support is around $198, which is where the trend line is located. The first major support is at the $192 level, which is also the 50% Fibonacci retracement level from the recent low of $177 to the high of $204.
If it falls below $192, the price may further test the support area at $184. Once the $184 support is breached, the price may retreat to the $180 support area in the short term.
Technical indicators
Hourly MACD – The MACD for SOL/USD is accelerating upward within the positive range.
Hourly RSI (Relative Strength Index) – The RSI for SOL/USD is currently above the middle line of 50.
Key support levels – $198 and $184.
Key resistance levels – $205 and $208.
