Indicators: RSI - volume
Timeframe: 1 hour
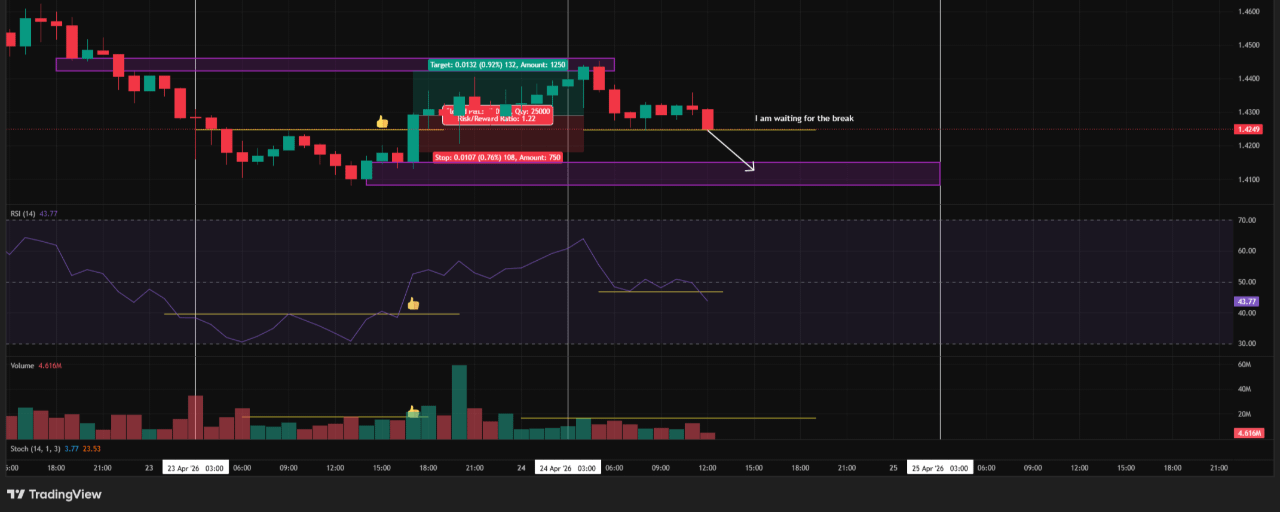
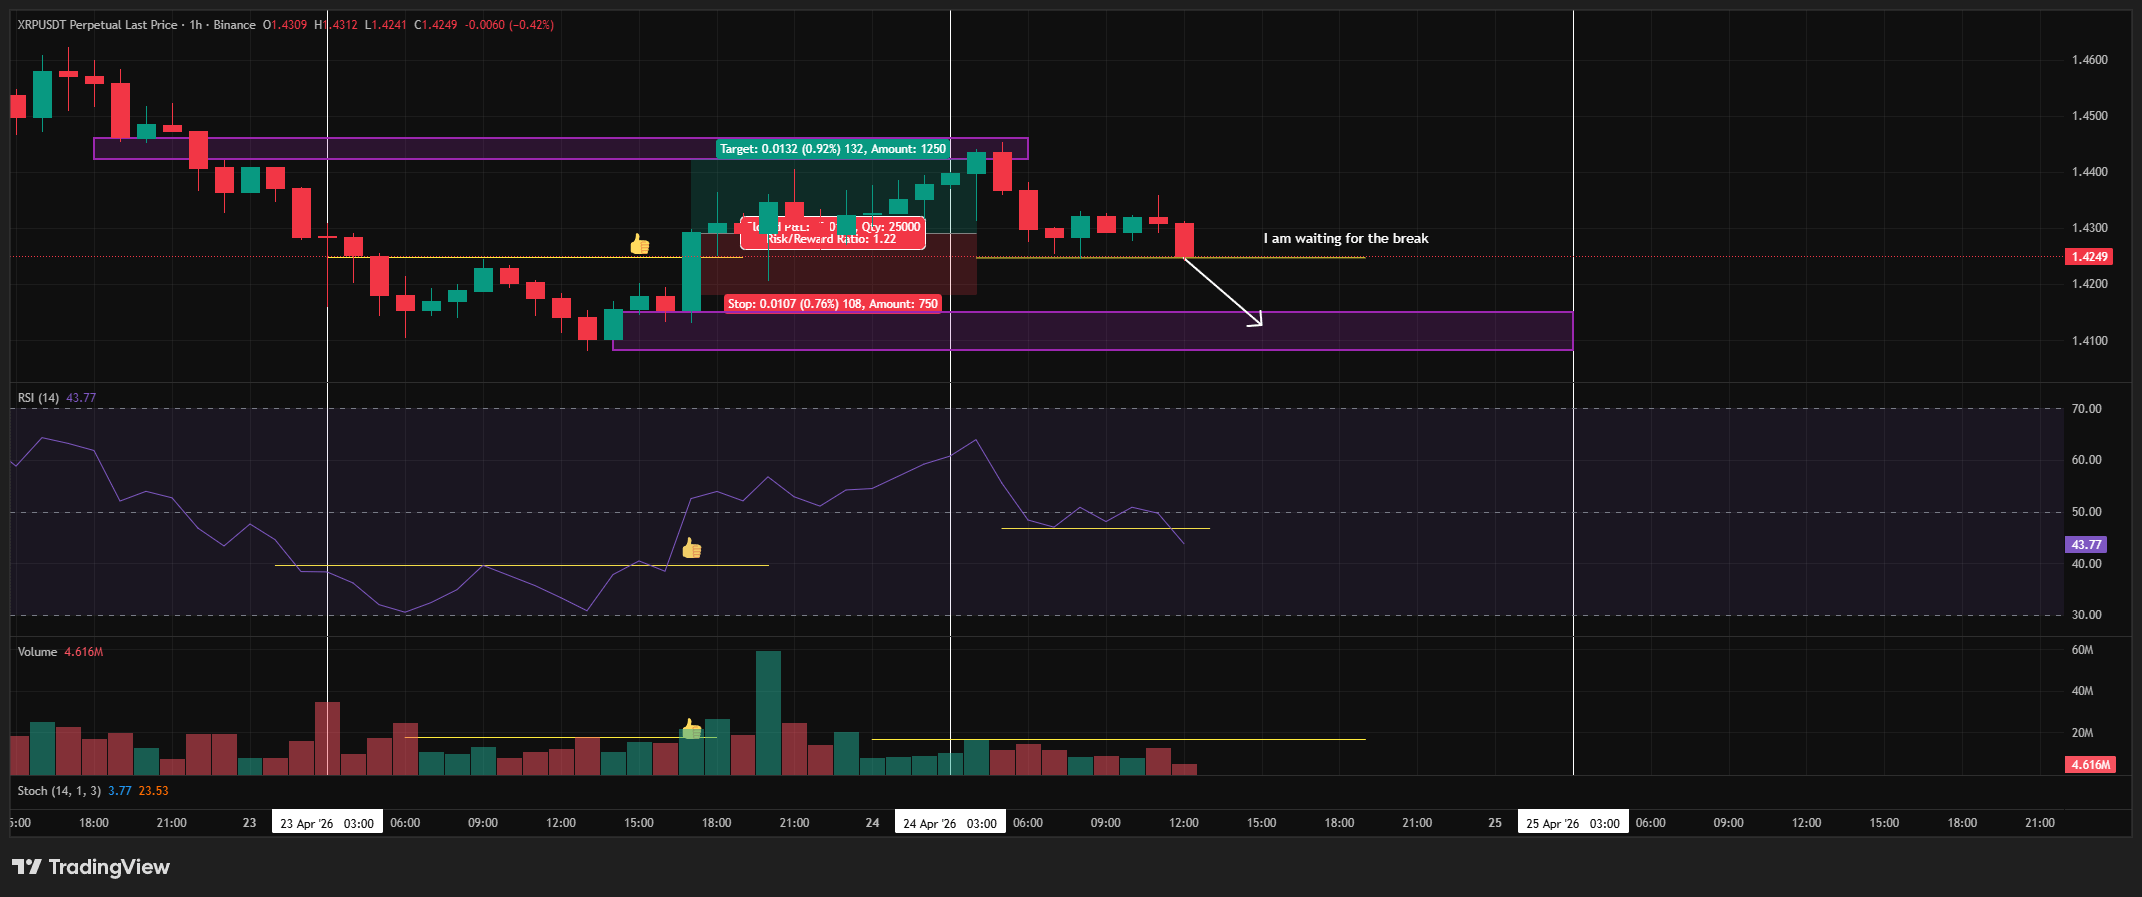
When you spot support or resistance zones, draw equivalent levels on the RSI and volume. If a line breaks with a single candle close across all indicators, jump in and set your target at the nearest support or resistance, as they can’t take on too much risk, just like shown in the picture. Trade from yesterday, and I'm waiting for today's trade; it’s also an opportunity for you.
I always look for coins with high volatility for trading and coins with low volatility for long-term positions to maximize profits. I always recommend the following coins #XRPUSDT🚨 #ZECUSDT #PIXEL/USDT .
And remember to know when to take profits, not just when to enter. Thank you all!