A lot of people are talking about $SIREN right now. But few really know how to read what the chart is telling us. Here’s my analysis based on real data from Binance.
📊 The raw facts from the chart
The daily chart speaks for itself:
Current price: $0.71 (+8.29% over 24h)
Market Cap: $517 million
Blockchain liquidity: $10.03 million
Holders: 47,294 wallets
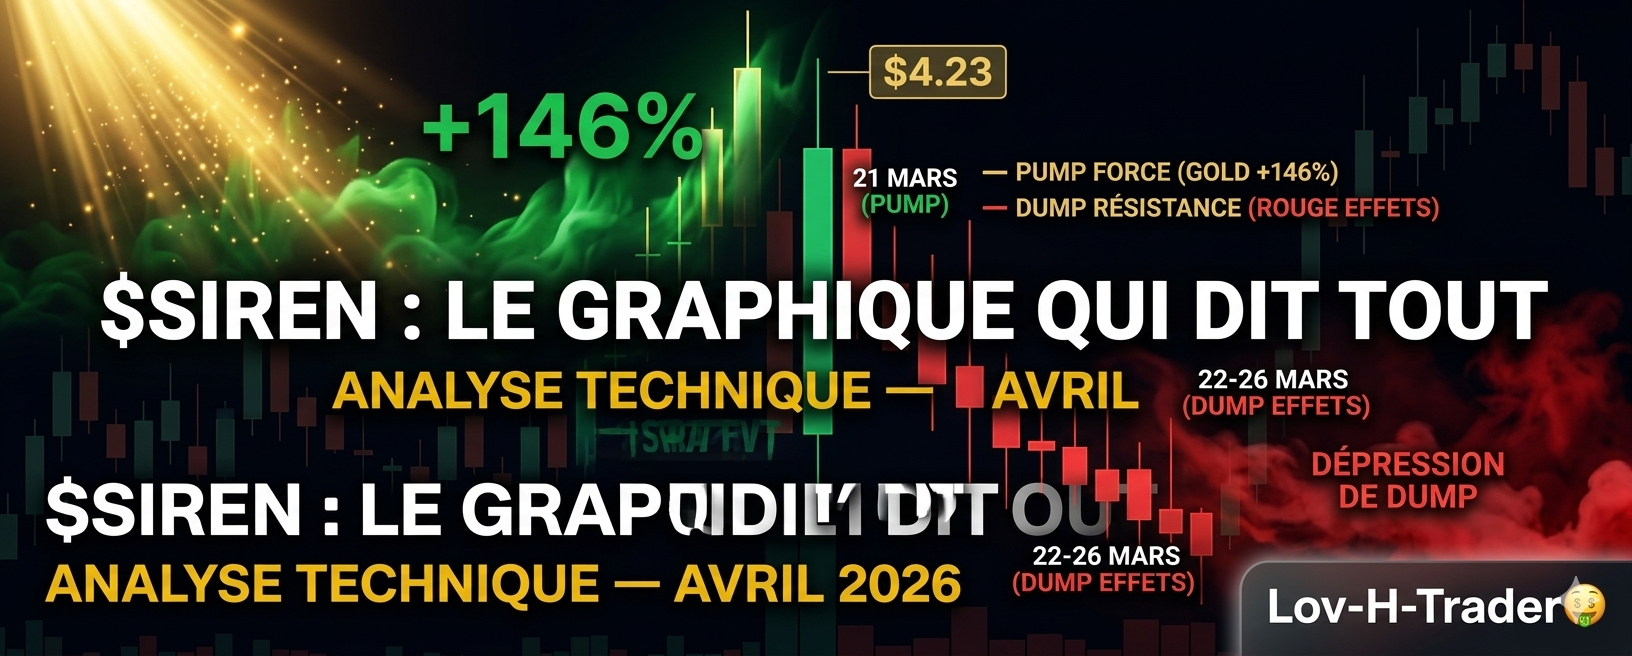
💥 The candlestick from March 21, 2026 — The key event
This is THE candlestick that everyone needs to analyze:
Open: $0.945
High: $4.238 — a violent pump
Low: $0.923
Close: $2.328
Change: +146% on this single candlestick
Volume: $107 million
A candlestick with such a long wick upwards is a classic signal of massive distribution. The big wallets sold at the top while the small buyers entered in FOMO.
📉 What the moving averages reveal
Three MAs visible on the chart:
MA(7): $1.006 — price well below → short-term bearish trend
MA(25): $0.600 — price above → intermediate support held
MA(99): $0.233 — far below → long-term trend remains bullish since launch
The price is currently compressed between the MA(25) and the MA(7). This is a critical decision zone.
📈 Volume confirms manipulation
The volume on March 21 reached $107 million — an abnormal spike for this token. Since then, volumes have drastically dropped. An exceptional volume on a distribution candlestick, followed by silence: this is the classic pump & dump setup.
🎯 Key levels to watch
Strong support: $0.60 (MA 25)
Immediate resistance: $0.82
Absolute danger zone: below $0.55
Bullish target if recovery: $1.73
🔍 My final analysis
SIREN is technically in a reconstruction phase. The current bounce of +8.29% is encouraging but not enough to confirm a reversal. We need a daily close above **0.82** with volume to hope for a return to $1.73.
Without this, the selling pressure from the big wallets will continue to weigh down the price.
⚠️ This is not financial advice. DYOR.
👉 Do you think SIREN can revisit $4? Or is it game over for this token? Let us know in the comments!