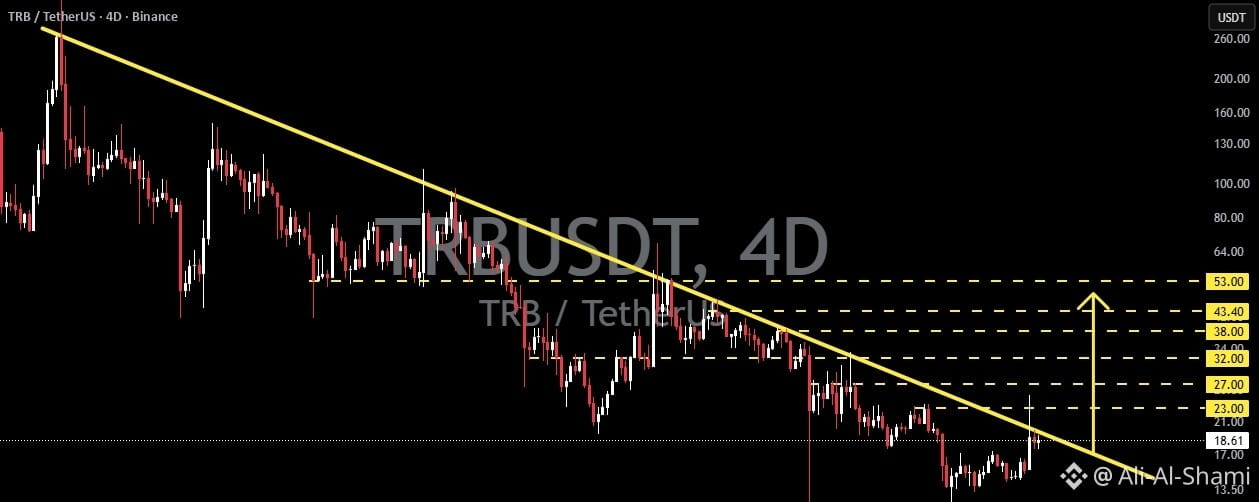
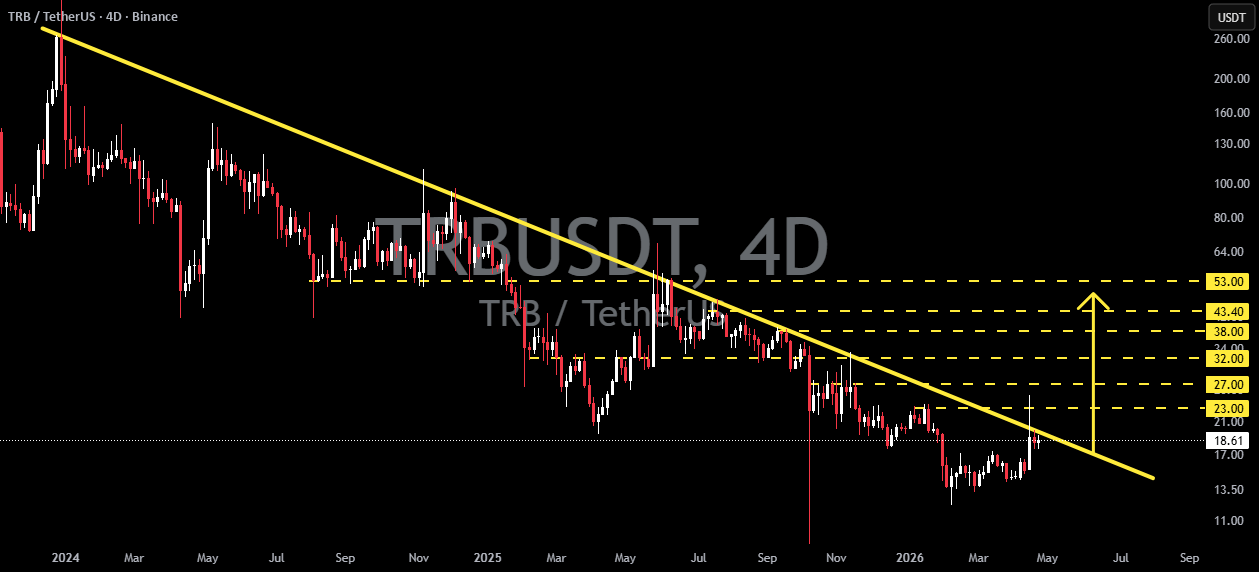
On the 4D timeframe for the TRB/USDT pair, it's clear that the price is still within a strong long-term downtrend, defined by a descending trendline (yellow line) that has consistently acted as a resistance barrier since the previous peak.
However, the price is now approaching a critical zone that could determine the next big move.
---
📊 Main structure and pattern
Pattern: Descending trendline / Retracement resistance
Price continues to form lower highs and lower lows → confirms a bearish structure.
Narrow pressure/consolidation forming near the trendline → possible breakout signal.
The dotted horizontal lines represent areas of accumulated supply and demand.
---
📍 Key levels.
Resistance levels:
23.00
27.00
32.00
38.00
43.40
53.00 (major resistance).
Support levels:
17.00 – 18.50 (current demand zone).
13.50 (lower support in case of a crash).
---
🚀 Bullish scenario.
A bullish confirmation occurs if:
Price breaks and closes strongly above the descending trendline.
Supported by an increase in volume (valid breakout).
Bullish targets:
23.00 → initial resistance.
27.00 → confirmation of continuation.
32.00 – 38.00 → targets in the mid-range.
43.40 – 53.00 → major recovery zone.
📌 A valid breakout could signal the start of a trend reversal in the medium term.
---
📉 Bearish scenario.
The bearish trend remains if:
Price fails to break the trendline.
Strong rejection occurs around 21.00 – 23.00.
Downside potential:
Re-test 17.00.
The crash → continuation to 13.50.
📌 As long as the price stays below the trendline, the main trend remains bearish.
---
⚠️ Main outlook.
Price is currently in a decision zone.
The longer the price presses under resistance → the stronger the potential breakout.
Next move likely to be explosive.
---
🧠 Summary.
TRB/USDT at a critical point between continuing the bearish trend and a potential bullish reversal. A breakout above the descending trendline will be the main signal for a market direction change.
