ETHUSDT multi-timeframe technical analysis
1️⃣ Daily level (major trend)
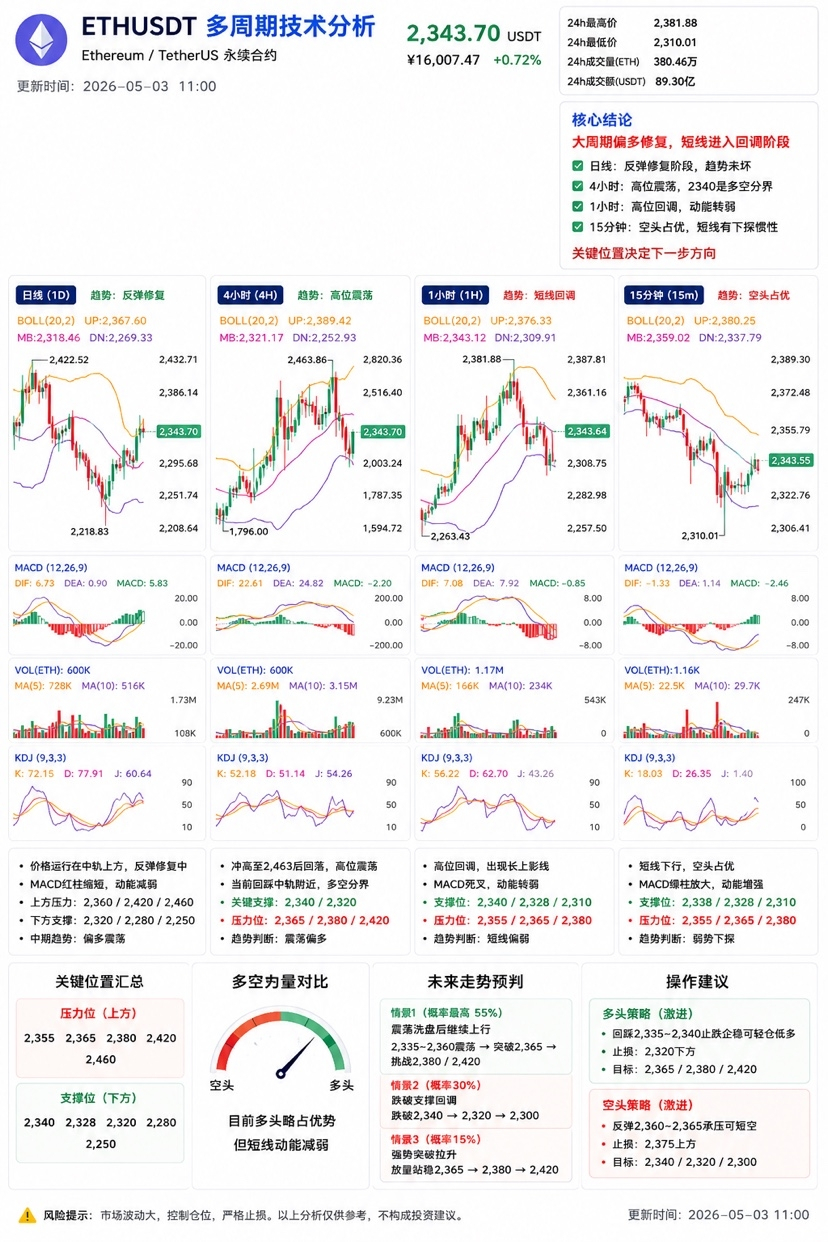
From the daily structure, ETH is currently in a mid-term bullish correction within a range.
Price is running above the middle band of the Bollinger Bands (2321)
A phase of resistance is forming near the daily high of 2463
The recent few candlesticks are starting to consolidate with decreasing volume
The current structure resembles:
Consolidation platform after a significant drop
And not a new major uptrend.
Key daily signals
MACD is starting to flatten out
Red bars are shortening
KDJ is showing signs of stagnation
Note:
Bullish momentum is weakening, but it hasn't fully flipped bearish yet.
Key daily levels
Resistance above
2360
2380
2420~2460 strong resistance zone
Support below
2320
2280
2250
As long as the daily line doesn't drop below 2320:
Medium-term still leans towards bullish consolidation.
2️⃣ 4-hour level (Core timeframe)
4-hour is very critical now.
In your chart:
ETH spiked to 2381 then quickly dropped
Long upper shadow appeared
Currently pulling back near the BOLL midline
This is typical:
Profit-taking after a spike
But for now, it’s not a major crash.
4-hour structure
Currently belongs to:
Post-rise high-level consolidation
It's not a one-sided drop.
Key observation:
Does 2340 hold?
Because:
Current price 2343
MA/BOLL midline are here
This is the boundary between bulls and bears.
If 2340 holds
ETH will:
Testing 2365 again
Then rushing to 2380
Even a second peak.
If 2340 fails to hold
Then it will:
Pull back to 2320
Then look at 2300
At that time, the 4-hour will form:
Small-scale head structure.
3️⃣ 1-hour level (Short-term)
1-hour has now appeared:
Short-term weakening signal
You can see in your chart:
High volume at the top
Long upper shadow
MACD death cross
KDJ pointing down
Note:
Short-term funds are pulling out.
But the key is:
Price hasn't completely breached the midline
Therefore:
Currently just:
Strong pullback
It's not a trend reversal yet.
1-hour key position
Pressure
2355
2365
2380
Support
2340
2328
2310
4️⃣ 15-minute level (Ultra short-term)
15-minute has entered:
Bears control the rhythm
In your chart:
Continuous bearish candles suppressing
MACD green bars expanding
KDJ at a low level
Price sliding along the 5MA
Note:
Short-term still has inertia to dip.
15-minute rhythm judgment
Short-term high probability:
First pull back to 2338~2340
Then observe if it stabilizes
If:
Volume decreasing to stop the drop
MACD reducing green
KDJ golden cross
Then it will appear:
One short-term retracement.
5️⃣ Multi-timeframe resonance conclusion
Currently ETH belongs to:
「Big timeframe bullish + small timeframe pullback」
Structure.
Therefore:
Medium-term
Still hasn't gone bad.
Short-term
Has already started to cool down.
6️⃣ Next most likely trend (Probability analysis)
Script One (Highest Probability)
High-level consolidation washing out positions
Trend:
2335 support →
Retracement to 2360 →
Then consolidation.
This is the rhythm most commonly seen by the main players.
Script Two
Directly dropping below 2340
Then it will:
Accelerating pullback to 2320
Even 2300
Short-term sentiment will clearly turn bearish.
Script Three (Lower Probability)
Strongly pulling back up again
Premise:
Volume stabilizing at 2365
MACD expanding again
This will challenge again:
2380
2420
7️⃣ Trading strategy (Technical perspective)
Aggressive short-term
Waiting:
Stop loss around 2335
15-minute golden cross
Consider buying low again.
Conservative approach
Waiting:
Re-establishing stability at 2365
4-hour closing green confirms
Then follow the trend.
Risk Points
If:
2340 continues to fail to hold
Breaking below 2320 with volume
Then:
ETH short term will enter deeper correction.