Volume-price divergence refers to the phenomenon where the price trend and trading volume trend are inconsistent, usually reflecting signals that the market trend may change. It can be categorized into the following two situations:
Price rises, volume decreases (bearish divergence):
The price continues to rise, reaching new highs, but the trading volume gradually decreases. This indicates that buying power is weakening, and the price increase may lack sustained momentum, posing risks of a pullback or reversal in the market.
Price drops, volume increases (bullish divergence):
The price continues to decline, reaching new lows, but the trading volume gradually increases. This indicates that the selling pressure may be weakening, and there could be buying interest entering the market, suggesting potential upward price reversal.
Key points of analysis:
Volume-price divergence is often combined with candlestick patterns (such as highs, lows, trendlines on candlestick charts) and other technical indicators (such as RSI, MACD) for comprehensive judgment.
Divergence signals are not absolute and must be confirmed in conjunction with market conditions, support and resistance levels, and other factors.
Commonly seen at the end of a trend, may indicate a reversal or adjustment.
Momentum Indicator is a technical analysis tool used to measure the speed and strength of price changes in financial assets to assess the strength of price trends or potential reversal points. It is typically calculated by comparing the current price to the price from a period ago, reflecting changes in market buying and selling forces.
Common forms of momentum indicators
Basic momentum indicators:
Calculation formula: Momentum = Current Price - Price from N periods ago (N is a user-defined period, typically 10, 14, or 20).
A positive result indicates a price uptrend, a negative result indicates a downtrend, and a value close to zero indicates a weak trend.
Relative Strength Index (RSI):
RSI is a popular momentum indicator that ranges from 0 to 100.
Calculation formula: RSI = 100 - [100 / (1 + RS)], where RS is the average gain divided by the average loss.
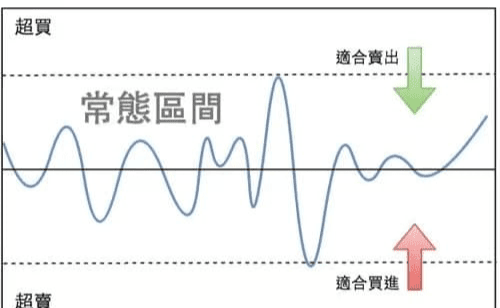
An RSI above 70 typically indicates overbought conditions, which may lead to a decline; below 30 indicates oversold conditions, which may lead to a rebound.
Stochastic Oscillator:
Measures the relative position of the current price to the price range over a period of time.
Formula: %K = [(Current Price - Lowest Price) / (Highest Price - Lowest Price)] × 100.
Commonly used to identify overbought or oversold conditions.
Moving Average Convergence Divergence (MACD):
Measures momentum through the difference between short-term and long-term moving averages.
Includes MACD line, signal line, and histogram, used to determine trend direction and reversal signals.
The role of momentum indicators
Trend confirmation: Helps confirm the persistence of price trends.
Overbought/Oversold: Identifies areas where the market may be too hot or too cold.
Reversal signals: When momentum weakens or divergences occur (e.g., price makes new highs but momentum indicators decline), it may indicate a trend reversal.
Trading signals: Generate buy or sell signals in conjunction with other indicators or chart patterns.
Usage considerations
Lagging: Momentum indicators are based on historical data and may lag behind actual price changes.
False signals: May produce misleading signals in choppy markets and should be used in conjunction with other analytical tools.
Parameter settings: Different period settings can affect the sensitivity of indicators, and adjustments should be made based on market and asset characteristics.