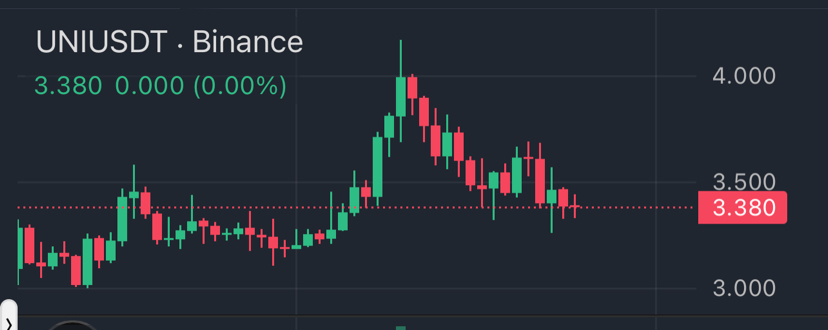

The current price is hovering around $3.380. Looking at the candlestick chart, we can see that the coin formed a head-and-shoulders pattern near the $4.100 levels in mid-May, and afterwards entered a gradual descending correction wave (quiet bleed) accompanied by a noticeable drop in trading volumes.
The coin is now approaching a crucial horizontal support zone, both psychologically and technically, ranging between $3.300 and $3.250. The market order book shows a clear dominance of sell orders at 62.06% compared to 37.94% for buys, indicating that selling pressure is prevailing in the short term, and the coin is looking for a bottom to build new accumulation liquidity.
2. Potential price targets (realistic)
• First target: $3.650 (a nearby resistance level and represents the last retracement line).
• Second target: $4.050 (re-testing the last targeted peak).
• Strategic target: $4.500 (the target area in case of breaking the previous peak and sustaining liquidity).
3. Expected timeframe to hit targets
• First target: within (3 to 5 days) if Bitcoin stabilizes and enters a sub-wave rebound.
• Second target: within (10 to 14 days) and requires a real breakthrough of the medium resistance levels with high volume.
• Strategic target: within (3 to 4 weeks) and is linked to the overall performance improvement of the DeFi sector in the market.
4. Controversial scenarios
• Positive scenario: A daily close above $3.650 with strong volume opens the door for a qualitative jump towards $4.100 and then to the strategic target.
• Cautious scenario: The current volatility requires monitoring key support areas at $3.320 and $3.150; a daily close below $3.150 will completely negate the bullish outlook and bring us back to old bottom zones.
5. Golden advice for traders
"Don't put all your liquidity in at once in tight range zones." > The book is clear from its title; the current selling pressure in the order book (over 62%) tells you that buyers are waiting for lower prices. The best strategy now is to watch the price action at the $3.320 support touch and gradually activate entry (DCA) with a strict stop loss set below the $3.150 levels.
6. What will happen in the coming days?
The most likely scenario for the next few days is a sideways movement slightly leaning towards a drop to accurately test the support area between $3.326 and $3.300. The market needs to flush out the remaining long leverage before starting any real upward wave. Expect a boring range before the next price explosion.

