📌 Daily Timeframe – ETH Pullback Reaches Major Fibonacci Support
Ethereum continues its broader corrective pullback, and the daily timeframe is now reacting precisely at key Fibonacci levels.
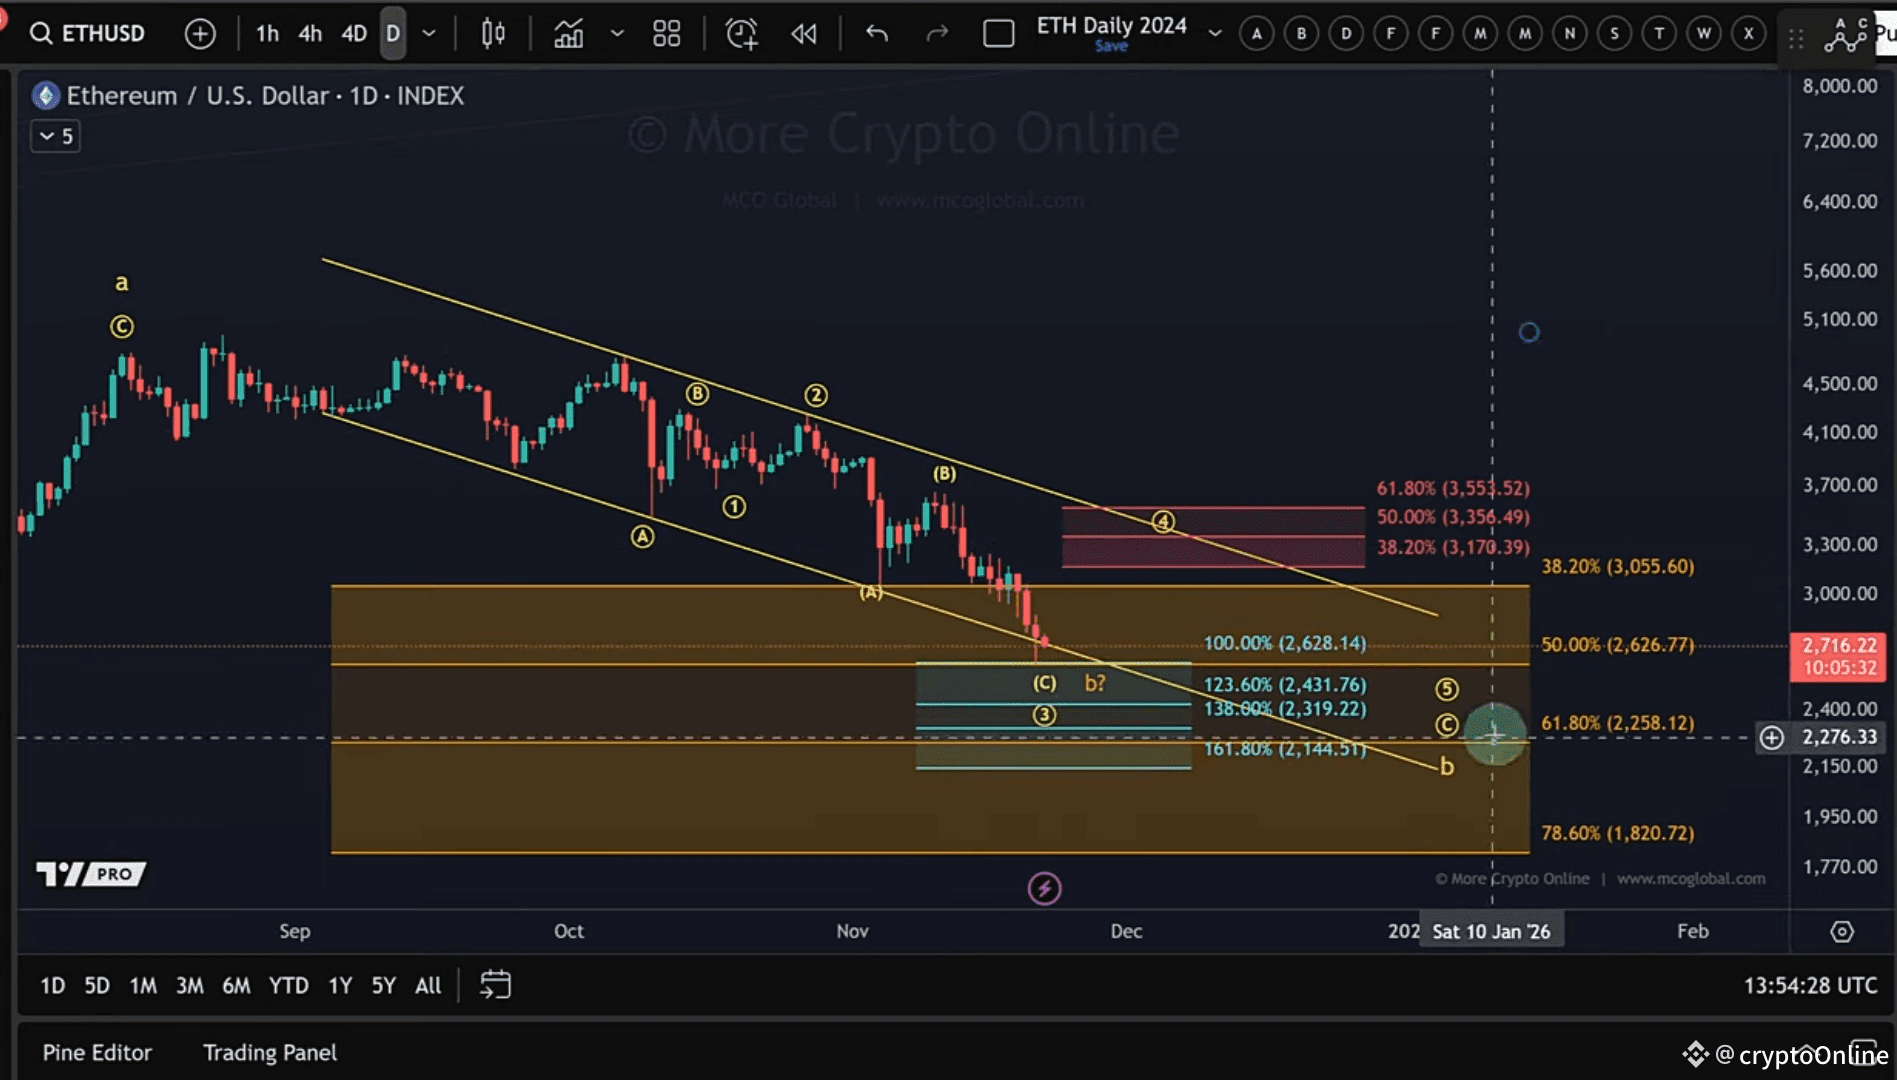
$ETH previously bounced nearly 20% from the 38.2% retracement at ~$3,355, a level that had no obvious structural support other than Fibonacci confluence.
While this bounce didn’t trigger a trend reversal, it confirmed the significance of the zone.
The next leg down has now reached the $2,620 support, corresponding to the 50% Fibonacci retracement—and once again, the market reacted.
🔹 Key Daily Levels
Support Zone: $2,620 – $1,820
Immediate Resistance: $3,170 – $3,530 (wave-4 rejection zone)
ETH could be forming a Wave 4 bounce here, but so far no evidence of a meaningful bottom is present.
The most probable scenario remains:
➡️ Corrective bounce (wave 4) → One more move down (Wave 5)
Still, a 5-wave impulsive move up on the shorter timeframe could shift this outlook towards a more bullish setup.
⏱ Short-Term Chart – Micro Support Tested
On the smaller timeframe, the market shows the first micro bounce, likely an (A)-wave of a larger Wave 4 correction.
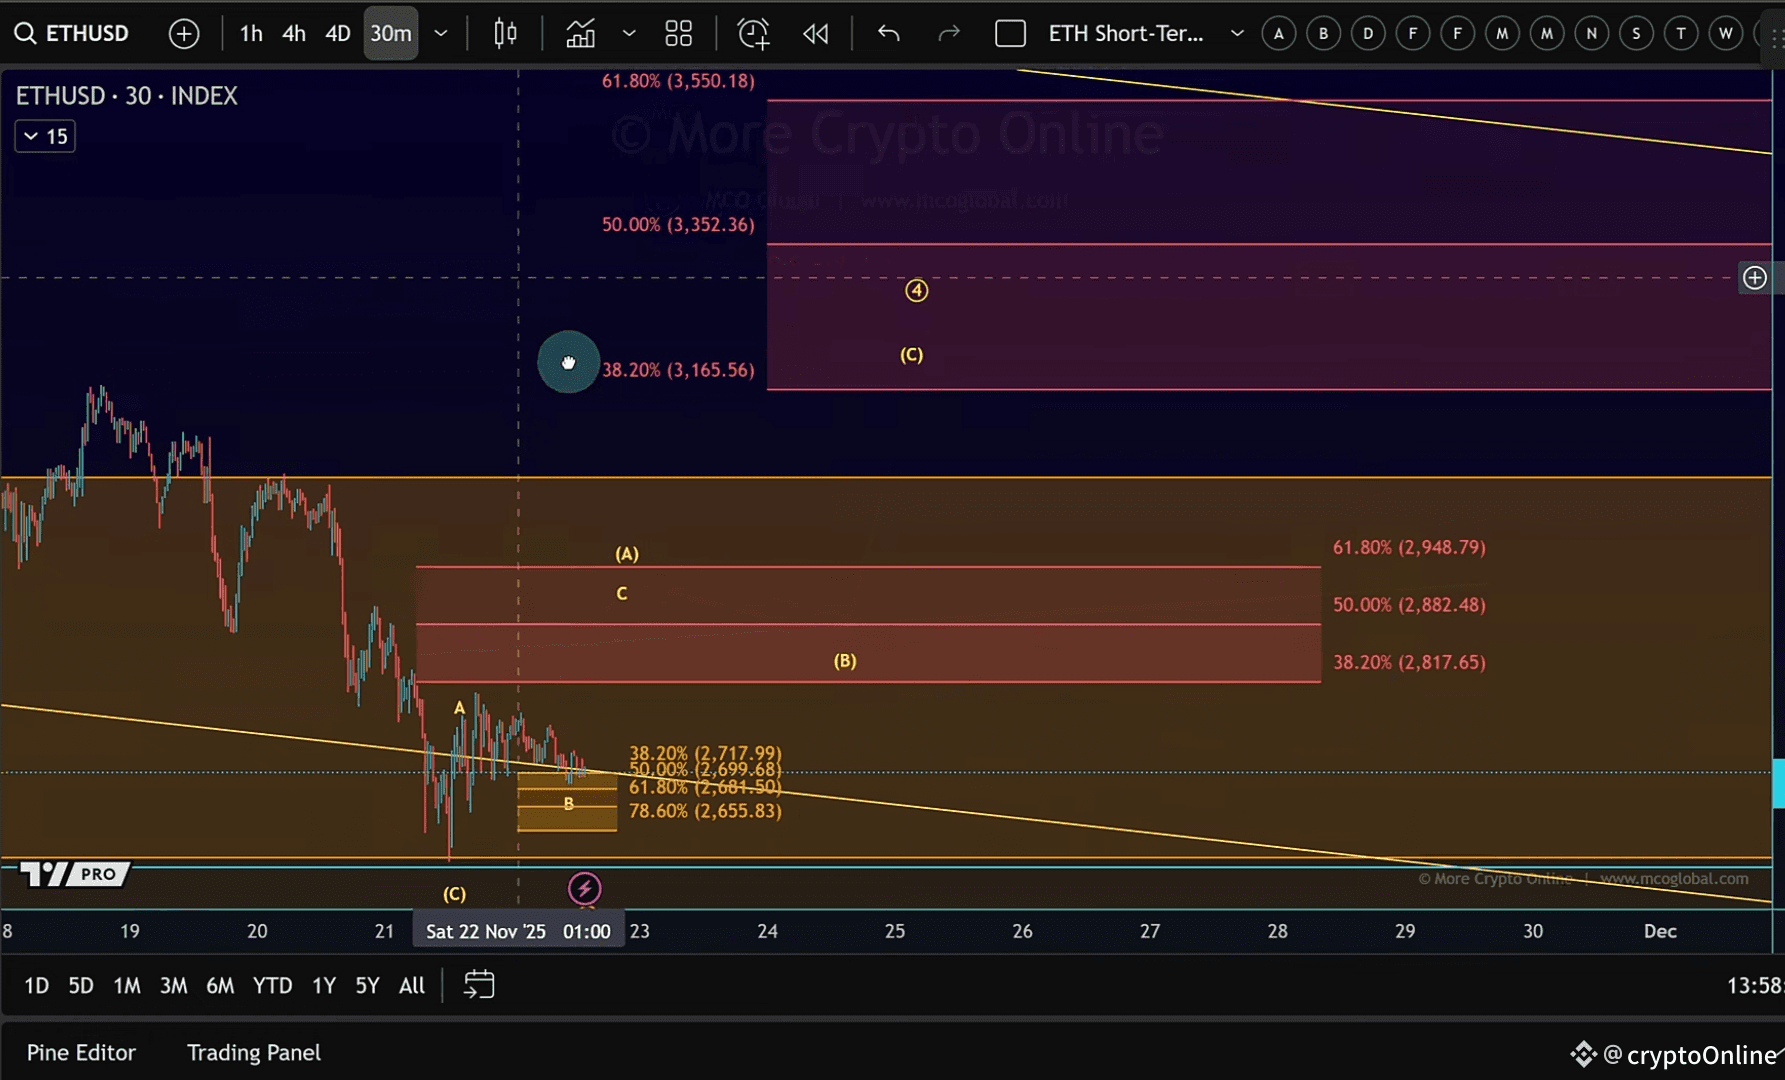
The reaction to the $2,620 level is visible, but so far strength is limited.
🔹 Short-Term Levels to Watch
Micro Resistance: $2,817 – $2,950
Micro Support: $2,655 – $2,718
To keep the bounce scenario alive, $ETH must hold $2,655.
A break below may activate direct bearish extensions.
At this stage, price structure remains small and weak there is no confirmation of a local bottom yet.
