Recently, #SHIB has dropped too sharply, but a noteworthy signal has quietly appeared on the chart - the double bottom pattern. This is usually seen as a 'possible reversal' structure, giving the bulls a glimmer of hope.
Amid the crash, SHIB shows key support.
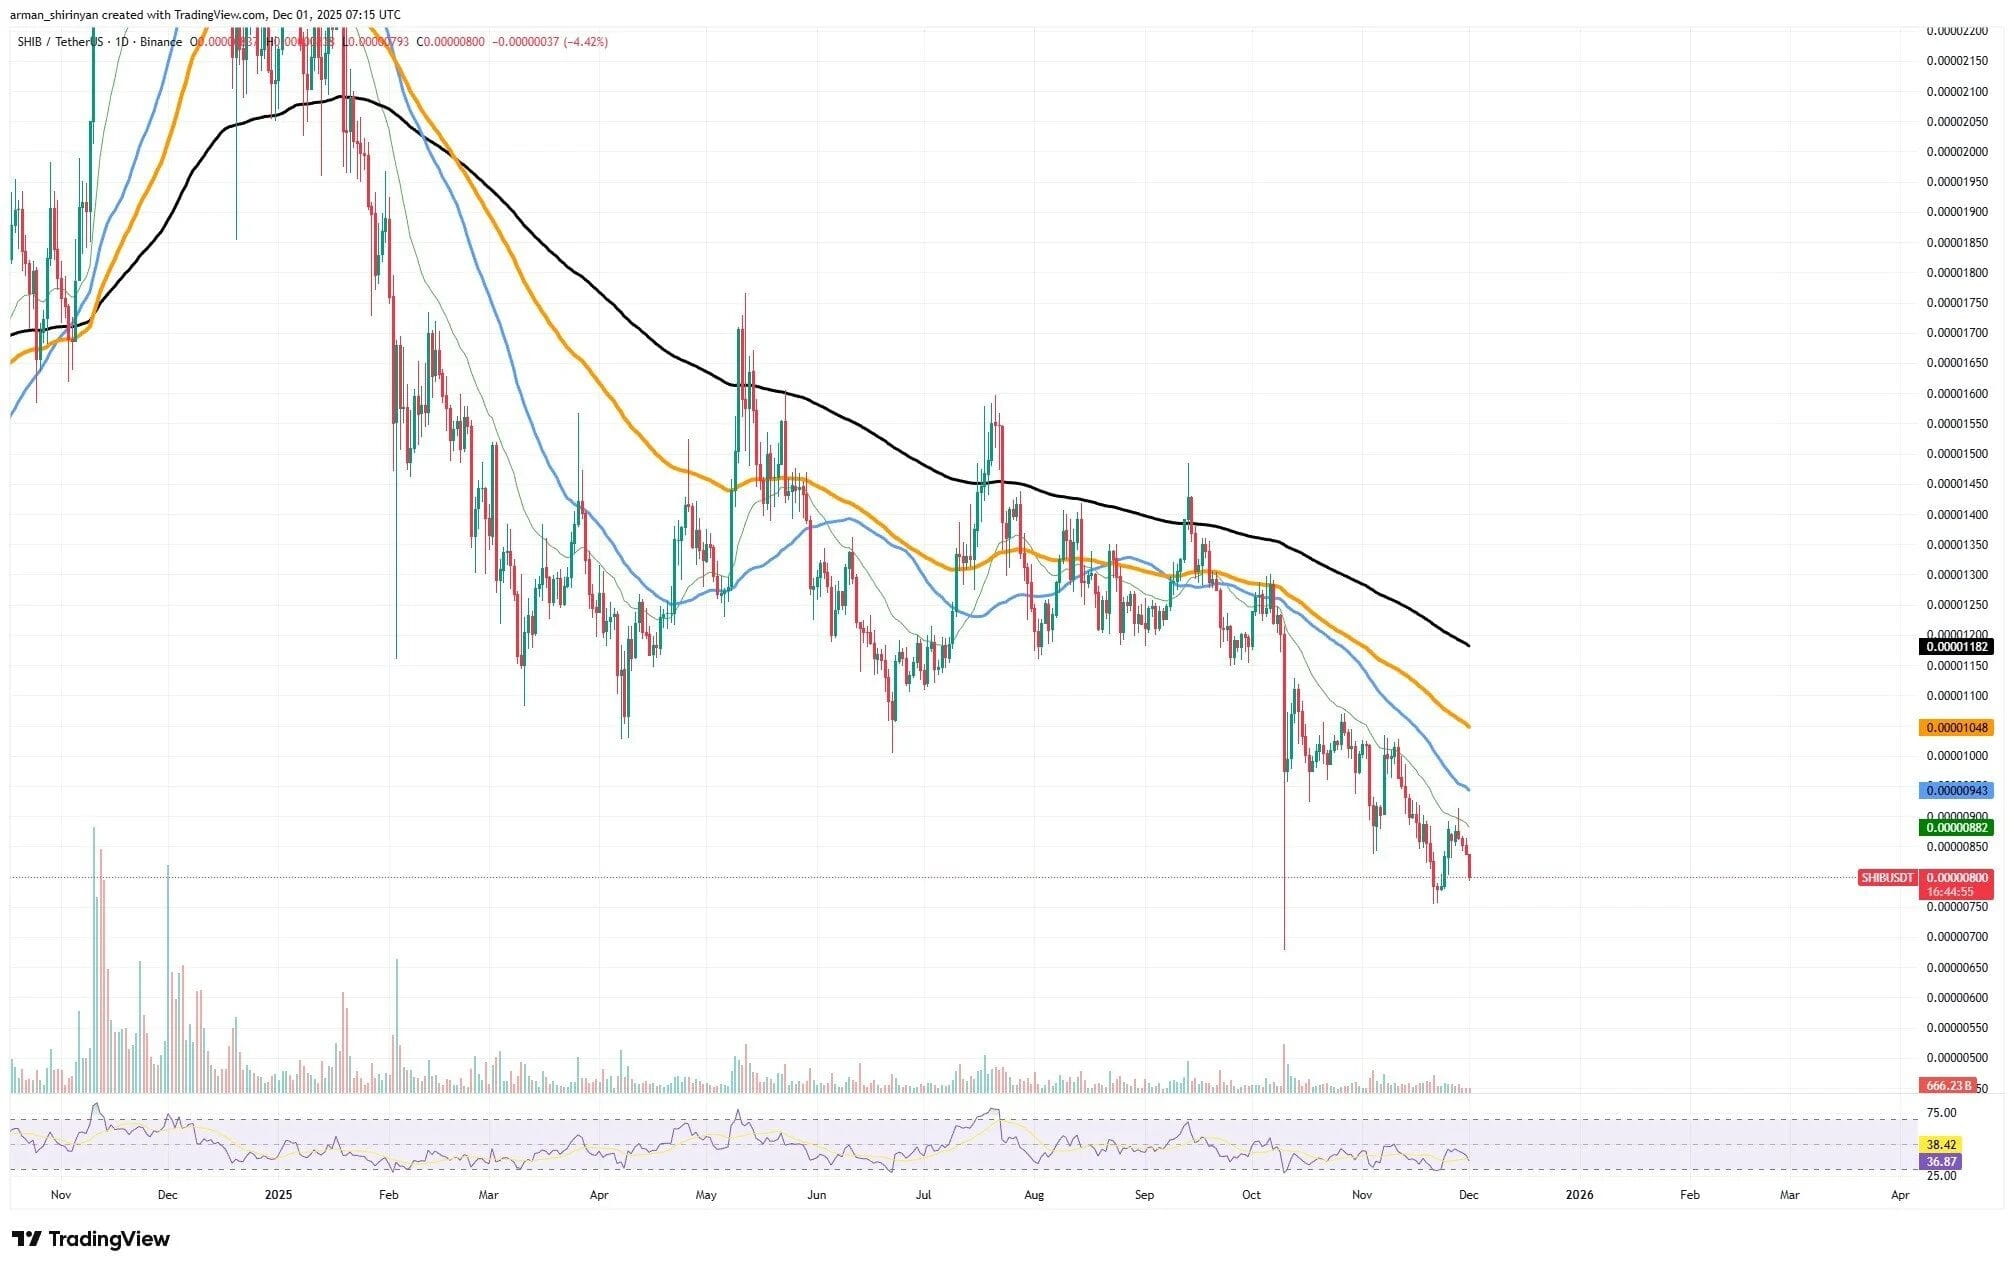
From the TradingView chart, SHIB has tested the bottom twice in the $0.0000078 - $0.0000080 range and successfully rebounded, with considerable strength.
This illustrates a problem:
Even if there are no new positive developments in the market and the sentiment is cold, the sellers seem unable to suppress it for now.
What does the double bottom really mean?
The double bottom is not a 'confirmed reversal', but it is indeed an obvious rebound signal.
However, SHIB is still facing three real issues:
The 50/100/200 day moving averages are all trending downwards.
→ The overall trend still remains weak.There is a 'stubborn' resistance wall above.
→ Approximately at 0.0000093 - 0.0000105 USD, SHIB has not been able to break through for several months.The trading volume is too quiet.
→ A true double bottom breakout usually brings an increase in volume, but currently, SHIB shows no signs of that 'buying excitement'.
So, although the pattern looks good, the market does not have the enthusiasm to match.
So, is there still a chance?
There is.
If SHIB can hold above 0.0000080 USD and then rise above 0.0000090 USD, there may still be short-term hopes for a surge—targeting around the 50-day moving average.
However, it should be reminded that:
This looks more like a sharp rebound rather than a major trend reversal.
To walk a big bull market, more catalysts are needed.
