
Key indicators (4 PM HKT on November 17 to 4 PM HKT on December 1)
BTC/USD: -9.6% ($95,600 -> $86,400)
ETH/USD: -11.9% ($3,200 -> $2,820)
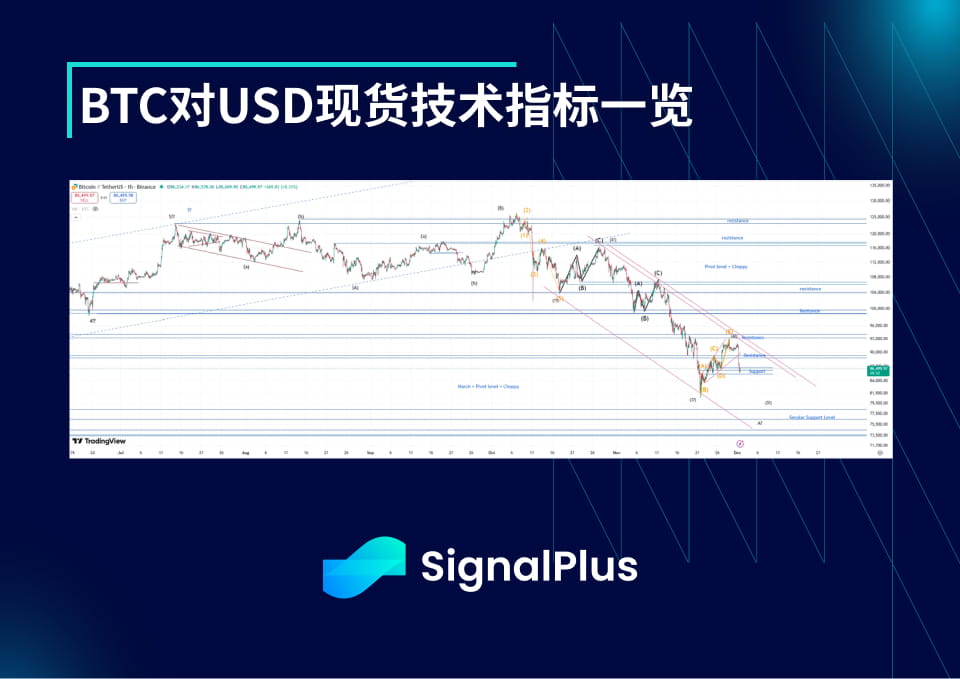
After a plunge to the key support level of $80,000 two Fridays ago, the market last week attempted to lay the groundwork for the anticipated 'Christmas rally' amid thin Thanksgiving liquidity, with prices correcting upward from the lows. However, at the start of this week, the market quickly faced a reality check: the accumulation of long positions and the pivot level of $89,000 triggered significant selling during the Asian trading session. Although we do indeed expect the market to create a 'Christmas rally' later this month (especially considering that the Federal Reserve is expected to cut interest rates), we anticipate that the most likely path forward is to retest the lows from the current level, which in the long term presents a great buying opportunity. Those participants who did not sell during last week's rebound may begin to panic, especially if we do not see prices quickly rebound/rise to resistance levels ($88.5–90K), further fueling the downward trend in prices.
The market has some other possible price paths — due to the complexity of the October flash crash event, this situation is more than usual — therefore, there is a considerable possibility that the current trend is merely a simple correction after an excessive rise in price during a period of thin liquidity, while the long-term uptrend has actually already begun. Another alternative possibility is that this is still part of a corrective trend before the last wave down (if we recover losses above $90,000 but fail at $100,000, this possibility will be clearer), but the more likely path is to see more downward price movements starting from here this week. We recommend starting to build a long position in batches from this point (at the $85.5–86.5K level) and adding more when closer to $80–81K. For the bold, further accumulation can be done in the $78–80K range (the important long-term support level is below this range). The key pivots for upward movement include above $89,000 and $94,250, while $100,000 is the critical pivot point; if broken, it will reopen the door for us to the $125–130K area (this is the target for wave B after this round of movement).
Market themes
The market has experienced extreme volatility in recent weeks due to the pendulum-like shifts in FOMC interest rate pricing, dropping from a 90% probability of a rate cut in December to 30%, then returning to 90%. High beta tech/AI stocks and cryptocurrencies have been the most affected, while the VIX briefly revisited this year's highs of 25–26 (not including the >40 highs caused by tariff issues in March-April). Although the VIX level again limited further price increases, the overall macro fundamental backdrop remains favorable for risk assets, as the Fed's interest rate path has not experienced any substantial changes. The market is no longer able to maintain a risk-averse state for a long time, as positions have been reduced ahead of Thanksgiving, and we are seeing a general rebound in risk assets.
After leading high-beta risk assets lower, cryptocurrencies have not escaped the continuation of the downward trend. BTC broke below the critical support of $85,000 two Fridays ago, triggering a rapid decline to test the strong support at $80,000. Since then, we have seen a corrective rebound amid thin liquidity and exhaustion of sell-offs, with overall risk sentiment improving as the market attempts to find a bottom. Unfortunately, after the events of October 10-11, market sentiment/structure seems to have fundamentally weakened, so this cycle 'may be different', meaning that buying intentions and new liquidity may not be enough to push prices significantly back up and break through $100,000. The outflow of funds from IBIT has increased but is far from the scale of sustained inflows we observed throughout the summer, and its fund flow trend will be a key point to monitor in the future. Interestingly, the performance of altcoins has been relatively strong, which is unusual in a cryptocurrency 'bear market', indicating a deeper level of deleveraging (again related to the impact of the events on October 10-11), and overall positions in altcoins are much cleaner (except for DAT holdings, though Tom Lee has not slowed down ETH purchases... at least not for now!).
BTC implied volatility
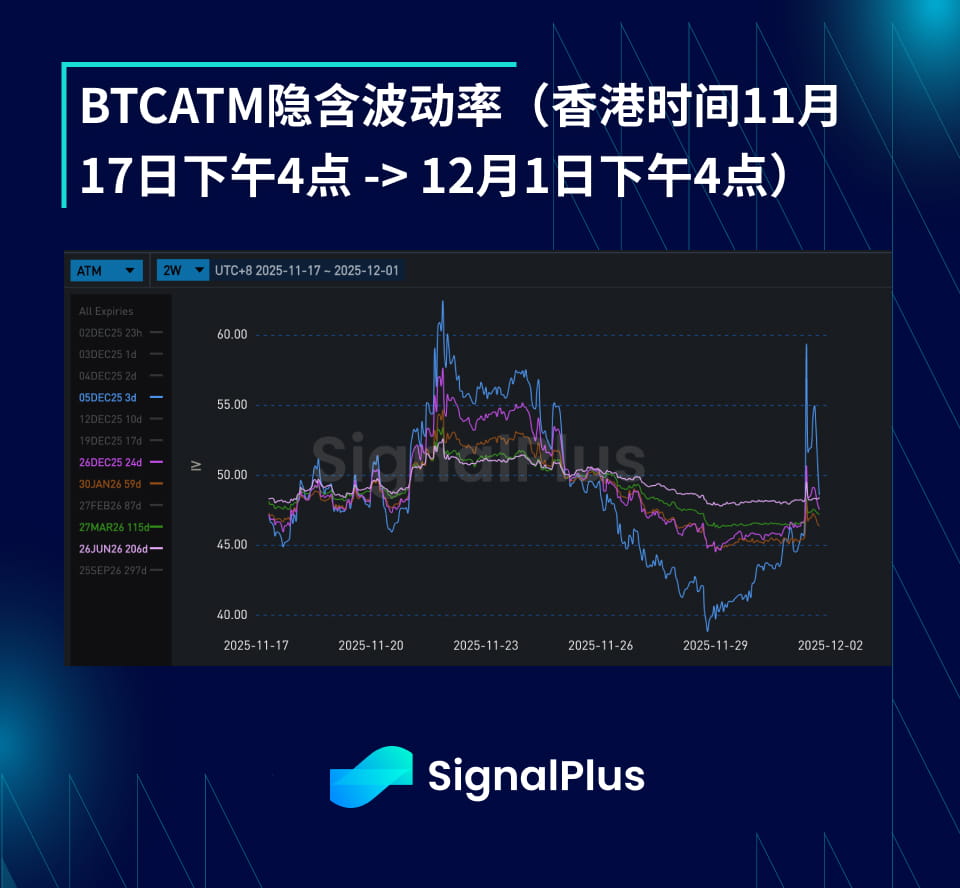
In the past two weeks, the implied volatility range has been very large, with the volatility of contracts with a term of less than 2 months soaring as the coin price approached the $80,000 low. This was followed by a sharp decline due to last week's low volatility slow correction upward, and then it rose again with a new round of selling starting from the $90.5–85.5K range during the Asian session. The actual volatility has remained high at 48–52%, so the decline in implied volatility can only be attributed to position reduction ahead of the year-end, while market makers hope to recover the selling flow of directional trades.
The term structure of implied volatility has generally flattened, as some selling pressure on long-term volatility makes expiration dates greater than 3 months slightly heavy, while short-term contracts continue to be supported due to elevated actual volatility.
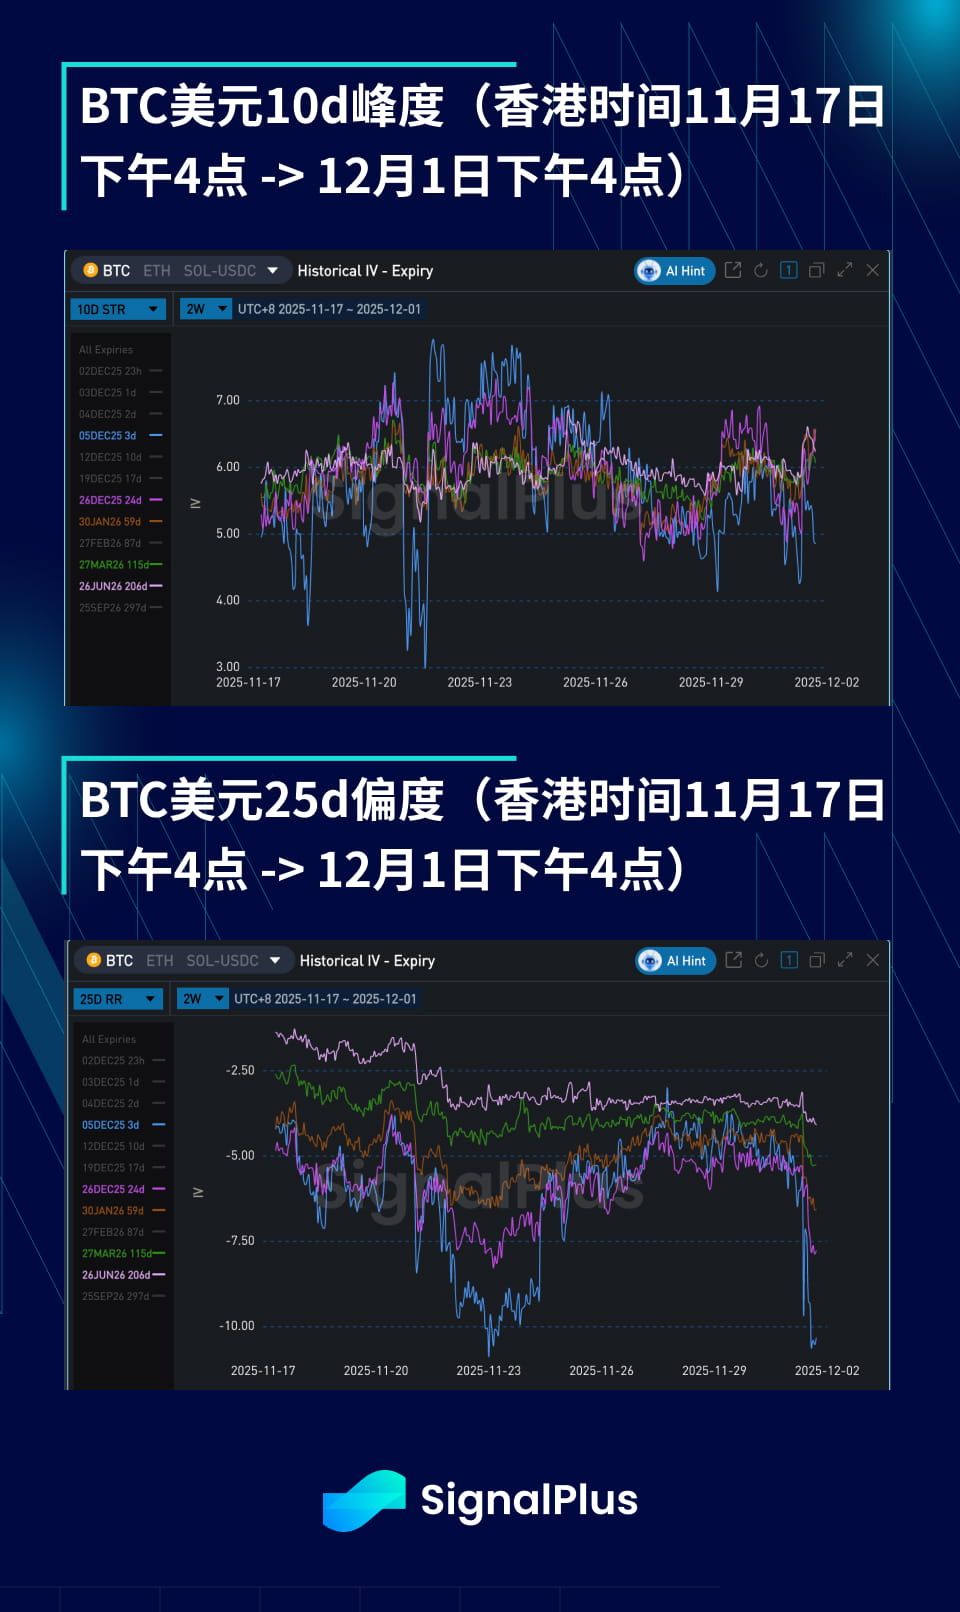
BTC skew/kurtosis
Wishing you successful trading next week!