After a prolonged local dip $BTC we've hit a critical point of local balance. The charts have formed clear zones of interest for both big players (market makers) and retail traders.
Using the latest data from The Kingfisher platform, let's break down the closed market positions: where the money is hiding and which scenario is the most likely.

🔍 Technical picture: Seeking support
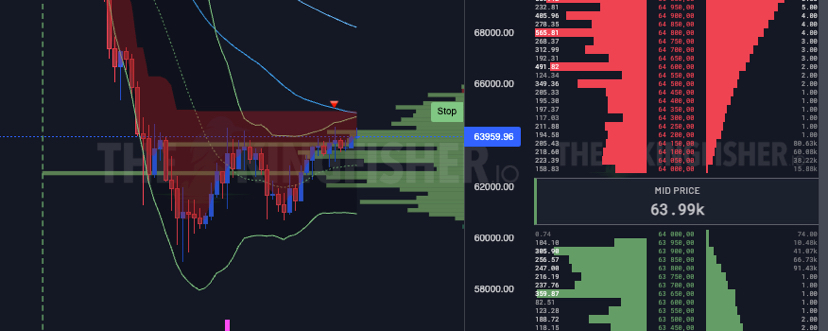
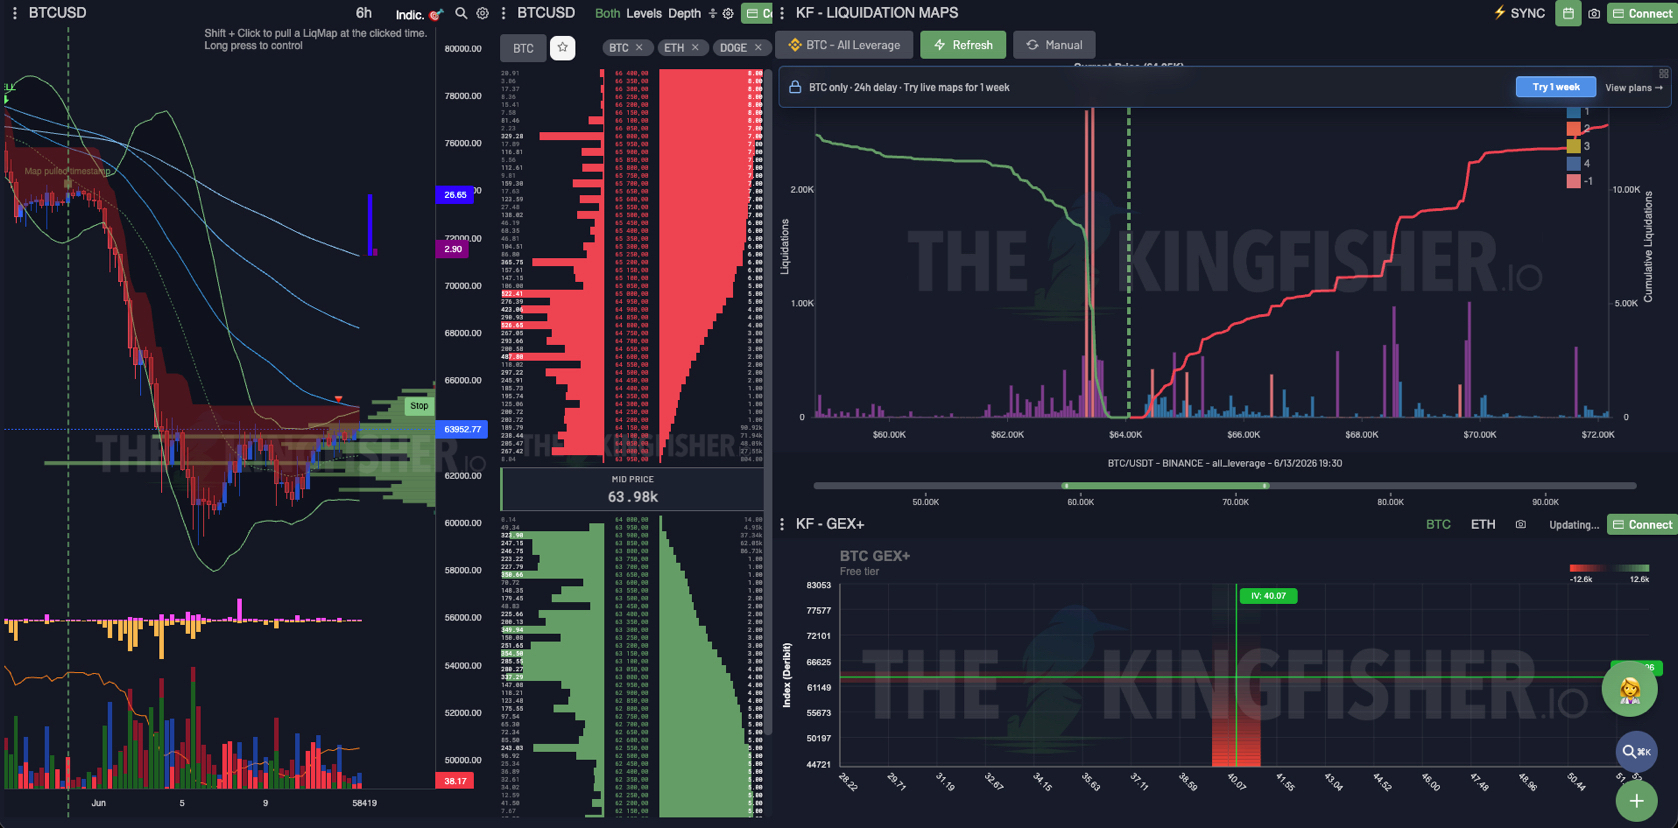
Currently, Bitcoin is consolidating around the psychological level of $63,980 (Mid Price). After an aggressive downward impulse, the price has found a local bottom.
Buyer protection zone: On the Volume Profile, a green support block is clearly marked in the range of $62,000 – $63,000. Here, limit buyers are actively holding off further declines.
Resistance wall: Above the full consolidation, a red cloud of supply has formed. Sellers are ready to meet the price in the corridor of $65,000 – $68,000.
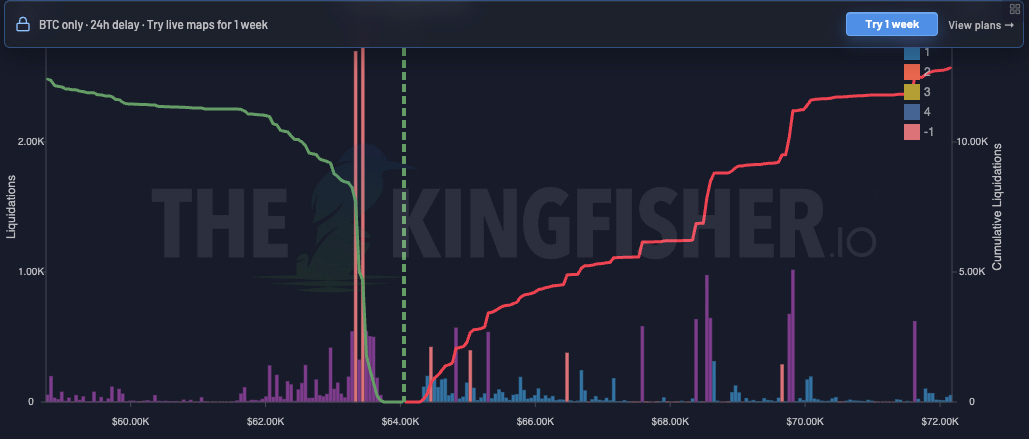
🗺️ Liquidation map: Where is the 'fuel'?
The market is driven by liquidity. Market makers always steer the price to where the most stop-losses and liquidation points of open positions with leverage are accumulated.
🩸 Longs (Hunting for nearby positions)
Right below the current price, in the narrow range of $63,000 – $63,200, two abnormally high purple clusters of long position liquidations have formed. These are the 'closest money' eagerly waiting to be taken out with a quick impulsive spike. Below $63k, cumulative liquidation of buyers is practically absent — falling further makes no financial sense.
🚀 Shorts (Massive fuel for growth)
If you look to the right of the current price, the cumulative liquidation of short positions (red line) is rising sharply and continuously up to the mark of $70,000. Across the entire chart, large pools of liquidations are 'smeared,' with the thickest points at levels:
$66,500
$68,500
$69,500
❗️ Important conclusion: The potential for growth (short squeeze) in terms of liquidity far exceeds the potential for decline. Shorts have become the main fuel for the upcoming movement.❗️
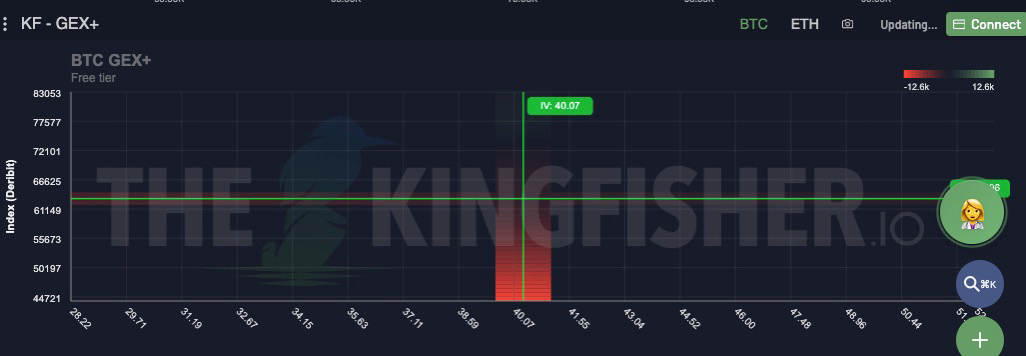
📈 Sentiment and Options (GEX+)
The Gamma Exposure (GEX) indicator on the Deribit exchange shows relative stability. The current implied volatility (IV: 40.07%) indicates that the market is 'coiling up' like a spring. Being in the red zone of delta hedging warns: as soon as the breakout begins — the move will be very sharp and ruthless.
🚦 Event scenarios: What should the trader expect?
Based on the collected metrics, we have two main scenarios. Both indicate a global reversal, but with different trajectories.
🟢 Scenario A (Priority): Squeeze and reversal through a V-shaped bottom
1. Manipulation: A quick, aggressive price spike down to the area of $63,000 – $63,150.
2. Outcome: Removal of 'nearby' longs and flushing out weak hands via stop losses.
3. Reaction: Instant buyback (V-shaped recovery) and the start of a cascading short squeeze with first targets at $65,200 and $66,500.
🟡 Scenario B: Direct exit from consolidation
Buyers are proving to be so strong that they won’t let the price even test $63k minimally. Bitcoin is starting to gently push the level of $64,500. Holding above it automatically triggers market orders to close shorts, pushing the price directly to $66,000+.
🛠️ Trading plan (Instead of a summary)
Shorting here is extremely dangerous. A massive wall of short liquidations above acts like a magnet.
The ideal entry point for a long is on a false breakout (if they give Scenario A) around $63,100 with a tight stop under $62,700.
Alternative long — in case of a confident breakout and retest of the level $64,500.
➡️ Evolution of analysis: From price observation to understanding market mechanics