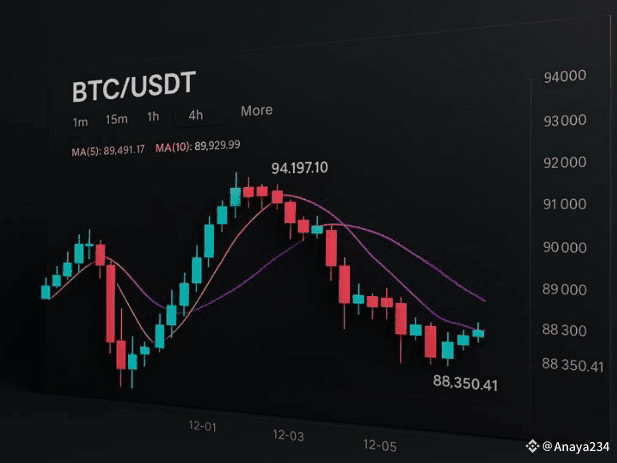
BTC/USDT 4H Technical Analysis – Market Structure & Key Levels
Bitcoin is currently trading around $89,300–$89,400, showing signs of short-term consolidation after a strong impulsive move. On the 4-hour timeframe, price action suggests the market has transitioned from an aggressive bullish phase into a corrective and neutral structure.
Market Structure Overview
The recent impulsive rally pushed BTC from the $83,800 support zone to a local high near $94,200. This move was strong and well-supported by volume, indicating genuine buying interest rather than a weak relief bounce. However, price failed to sustain above the $94K region, leading to a corrective pullback.
Since that rejection, BTC has entered a lower high and lower low sequence, confirming a short-term bearish correction within a broader bullish trend. Importantly, the correction remains controlled and has not invalidated the prior bullish structure on higher timeframes.
Moving Averages Analysis
On the 4H chart:
• MA(5) and MA(10) are currently below price but relatively flat, indicating short-term indecision.
• MA(20) is acting as dynamic resistance above the current price.
• The price is trading below MA(20) but above major structural support, suggesting a market in balance rather than breakdown.
The compression of moving averages typically precedes a volatility expansion, meaning a significant move is likely once price leaves this range.
Support & Resistance Zones
Key Support Levels
• $88,900 – $89,000: Immediate intraday support
• $87,800 – $88,000: Strong demand zone and previous reaction area
• $83,800: Major swing low (structure invalidation below)
As long as BTC holds above the $87,800–$88,000 zone, the bullish macro structure remains intact.
Key Resistance Levels
• $90,900 – $91,200: Immediate resistance aligned with MA(20)
• $92,000 – $92,200: Structural resistance
• $94,200: Previous high and major rejection zone
A clean break and hold above $92,000 would open the path for a potential retest of the $94,000 area.
Volume Insight
Volume has declined during the pullback, which is technically healthy. Falling volume on correction usually indicates lack of aggressive selling pressure, supporting the idea that this is a consolidation rather than a reversal.
Market Scenarios
• Bullish Scenario: Holding above $88,000 with increasing volume could result in a breakout above $91,000, targeting $92K–$94K.
• Bearish Scenario: Failure to defend $87,800 could trigger deeper pullback toward $85,000–$83,800.
• Neutral Scenario (Most Likely Short-Term): Price continues ranging between $88,000–$91,000 until a decisive breakout.
Conclusion
Bitcoin remains structurally strong on higher timeframes, while the 4H chart reflects a healthy consolidation phase. Traders should avoid emotional trades and instead wait for confirmation at key levels. Patience is critical, as compression phases often precede large directional moves.
Trend is paused, not broken.
$BTC