1. Market Fluctuation and Key Expectations: The Risk of a Second Bottom After Hawkish Rate Cuts
Recently, the price of Bitcoin has continued to fluctuate, leaving market participants feeling confused. Just yesterday, Bitcoin was still hovering around the $92,000 to $93,000 range, but has now quickly fallen to around $90,000. According to yesterday's analysis, the significant up and down differences in the market were mainly due to the news being much stronger than the technical aspects and causing a 'resonance suppression' with key technical positions.
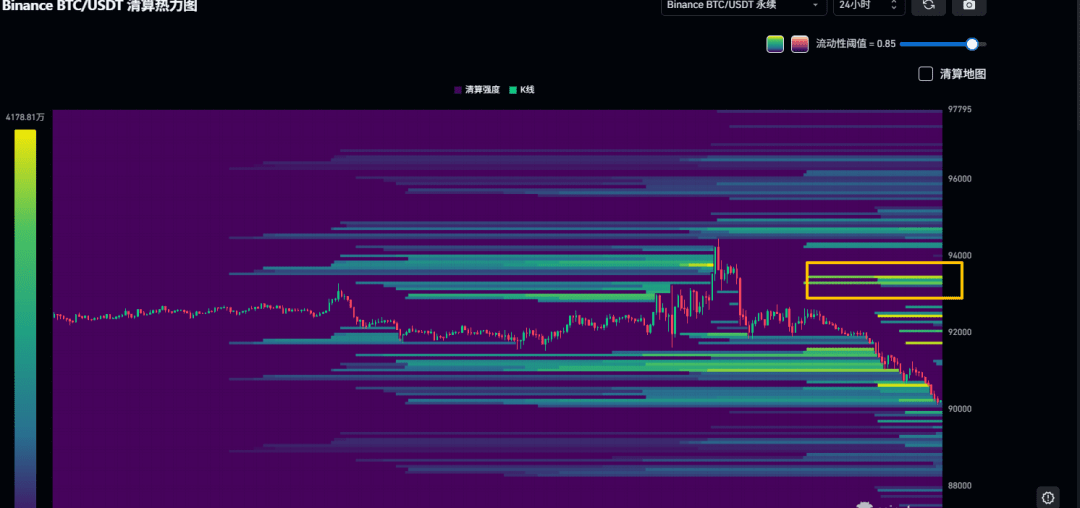
From the perspective of CVD (Cumulative Volume Delta) and the liquidation map, around $92,000 is the most concentrated stop-loss point for bulls, making it the easiest target for 'short squeezing'. Once this range is broken, the likelihood of the price retesting the $90,000 to $88,000 range is very high.
The funding situation is also clearly bearish, so yesterday's trend completely met expectations. If you evacuated in time at the key position, then the current price is close to the lower position of the previous knife-throwing range. Of course, this does not encourage blind bottom fishing, but emphasizes grasping risk and rhythm.

2. The Federal Reserve's rate cut of 25 basis points: why has good news turned into bad news?
"Hawkish rate cut" refers to the Federal Reserve cutting rates by 25 basis points, but the market views it as good news being exhausted, turning into bad news.
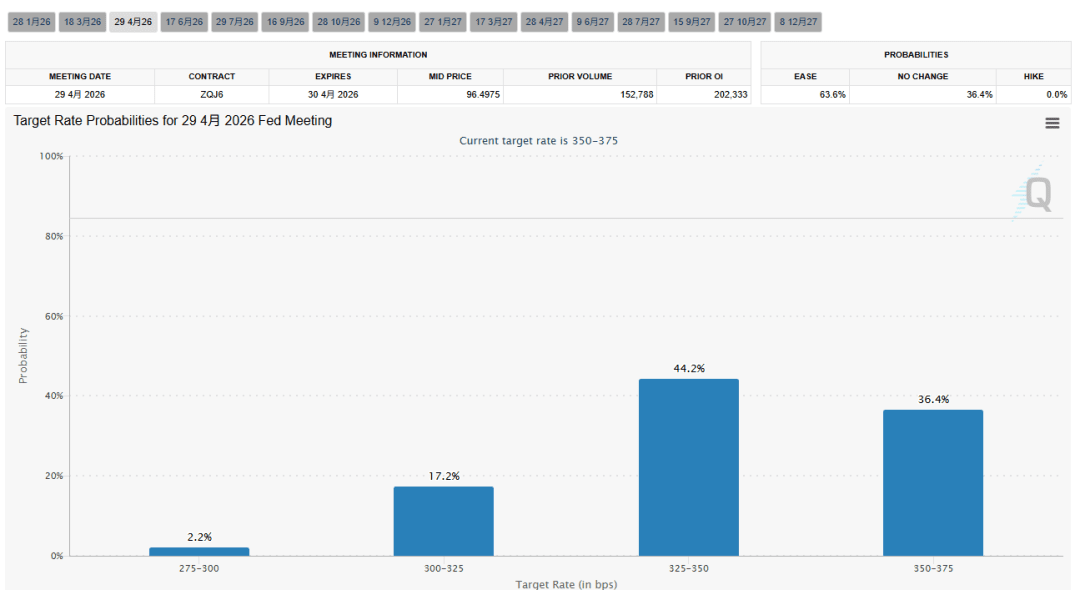
From the latest interest rate futures probability distribution:
The probability of a rate cut in January is only 22%
About 41% in March
In April, it is close to March, totaling only about 60% probability of a rate cut occurring once by June, with a roughly 20% chance of not cutting rates.
This means:
The overall probability of a rate cut appearing in the first half of the year is low, and the market's original imagination of the easing cycle has been significantly compressed.
The logic of the Federal Reserve is:
Current interest rates are in a 'reasonable range'; unless there is a further significant decline in the labor market, there will be no further rate cuts.
In addition, the chair of the Federal Reserve is likely to be succeeded by Haskett, with dense labor and inflation data to be announced in December. Although the overall tendency is not extremely hawkish, it still puts pressure on risk assets:
Inflation has been controlled, but the policy stance is cautious, and the market's expectations for easing have been pushed back to reality.
3. Weakness in spot, dominance of contracts: bulls are passive, and the wholesaler induces buying before crashing the market.
Recently, the spot CVD has continued to show signs of 'wholesale selling', with no green energy bars extending from the hourly level to the daily level, indicating that the rise lacks a foundation of spot buying, and the contract market is the dominant force.
Yesterday's market was a typical 'news day inducing buying' scenario:
1. The wholesaler quickly pulls the market with a small amount of spot, breaking through short stop losses and collecting liquidity.
2. Open short positions around 93,000 USD.
3. Immediately crash the market, relying on contract profits rather than spot selling pressure.
From a technical perspective, it can also be confirmed: if we ignore the news spike at 3 AM, yesterday's overall trend has formed 'lower highs', clearly entering a bearish structure.
The liquidation heatmap shows that the most concentrated area for long-short battles is around 93,000 USD, which is the best position for wholesalers to open shorts and liquidate longs.
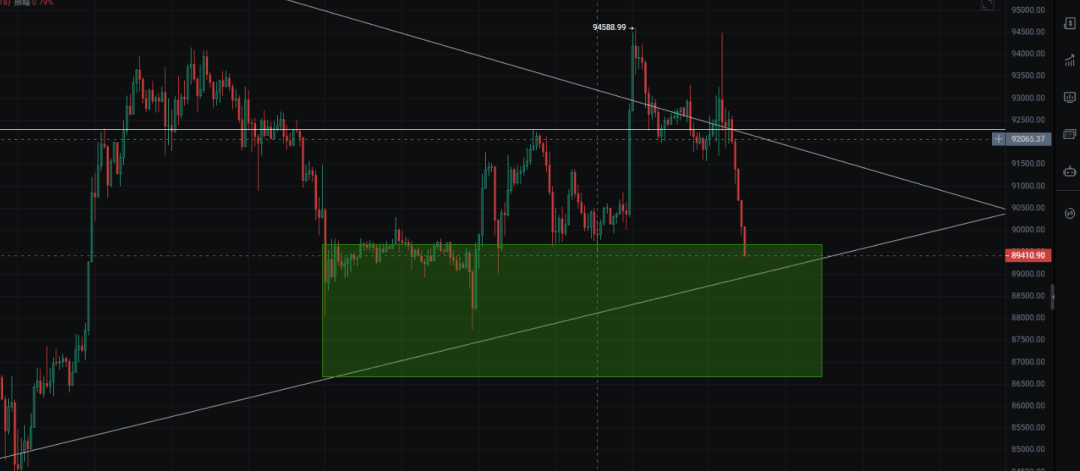
4. Technical structure: 88,000 is the lifeline for bulls, losing it will point to the 86,000–80,000 range
From a daily level perspective, Bitcoin showed a 'double needle testing the top and then falling back' yesterday, and it may still dip into the 88,000–90,000 USD range.
The core logic is:
If 88,000–90,000 USD holds → the daily bullish structure remains valid, and the lows are still above the upward trend line.
If 88,000 USD is effectively breached → the upward trend ends, and the price will test lower points, potentially triggering a second deep bottoming.
From a small timeframe perspective:
1.272 and 1.5 Fibonacci levels have been breached.
The next key testing point is the 1.618 area.
If this level is breached and then quickly recovered, it is a stop-loss signal and has conditions for going long; the stop-loss can be set slightly below.
If this level is not recovered, the hourly bullish structure will be completely destroyed, and the price will further enter the overlapping support zone of 86,000–88,000 USD.
It is particularly important to emphasize:
88,000 and 86,000 are positions that bulls must defend; once lost, 84,000 or even 80,000 USD will become foreseeable targets.
This is the most critical technical risk point in this market, and investors must pay close attention.
5. Case study of altcoins: Quick vacuum zone replenishment after trend breakdown
Taking the altcoin you mentioned in the TG group as an example:
Yesterday, its upward trend line showed signs of breaking, but was subsequently recovered, leading to a short-term long position in the VIP group that was successfully profitable.
However, the highest point only touched the key pressure before the market weakened again and truly broke the trend line.
At this point, the next testing point is in the 1.51 range.
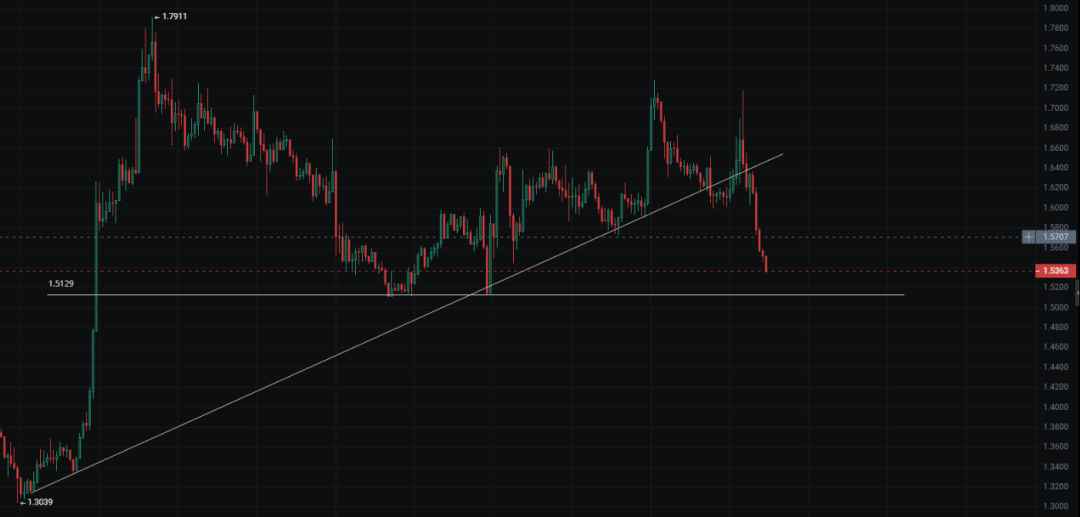
This level is also crucial for bulls; once breached, it will enter a 'price vacuum zone', likely retesting lower support.
This reflects the characteristics that most altcoins currently possess:
The trend is weak and highly volatile; once the trend line is lost, the decline often accelerates in a cascading manner.
6. Summary: The market has entered a critical defensive stage; maintaining risk control and rhythm is key.
Currently, BTC and mainstream altcoins have entered a critical structural range. The overall judgment is:
Macro is hawkish, funding is bearish, contracts are dominant, and spot is weak.
Technically, the 88,000–90,000 USD level is a lifeline; breaching it will trigger a deeper correction.
The possibility of inducing buying and washing the market remains high; a rebound needs to confirm that spot CVD and trends improve simultaneously.
If waiting for a reversal signal, stabilization at the 1.618 position is very critical.
At this stage, both 'blind bottom fishing' and 'panic chasing' are not rational strategies; the key is:
Find clear support confirmation points before taking action.
Set stop-losses properly.
Control position size to avoid becoming liquidity for contract liquidation.

