
The price of Aave continues to trade within a descending parallel channel, with the possibility that a breakout could lead to an upward movement.
On-chain and futures data indicate bullish sentiment, with large orders from whales, calming conditions, and buying dominance.
The technical setup supports the possibility of a breakout, with a price target for the pattern near $296.
The price of Aave ($AAVE ) is trading above $204 at the time of writing this report on Friday and is approaching the upper limit of its descending parallel channel; a breakout from this structure would be favorable for the bulls. Moreover, on-chain data and futures also support the bullish sentiment, while the technical targets of the pattern suggest a rise above $296.
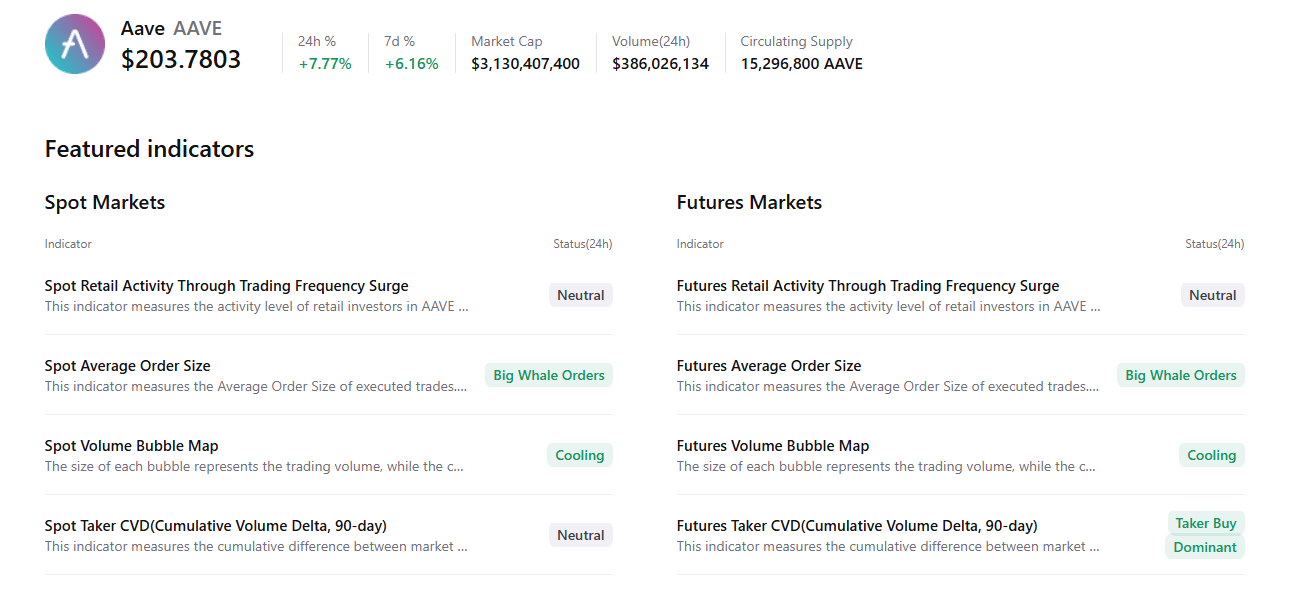
Aave's on-chain data and futures show a bullish bias.
CryptoQuant's summary data also supports the bullish outlook, as Aave's spot and futures markets show large orders from whales, calming conditions, and buying dominance. These factors indicate the potential for a price increase in the coming days.
On the futures side, Aave's funding rate data also supports signs of an increase. According to the interest-weighted funding rate data from Coinglass, the number of traders betting on the price of $AAVE declining is fewer than those expecting a price increase.
The metric turned positive on Wednesday and stands at 0.0088% on Thursday, indicating that long positions are pushing short positions. Historically, as shown in the chart below, when funding rates shift from negative to positive, Aave's price rises sharply.
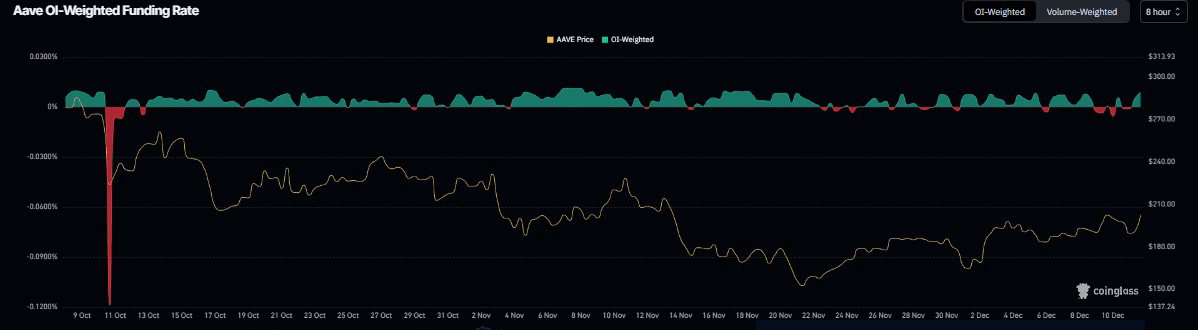
A chart of Aave's funding rates. Source: Coinglass
Additionally, the long to short positions ratio for Aave reads 1.01 on Thursday, nearing a monthly high. This ratio, which is above one, reflects bullish sentiment in the markets, as more traders bet on the asset's price increasing.
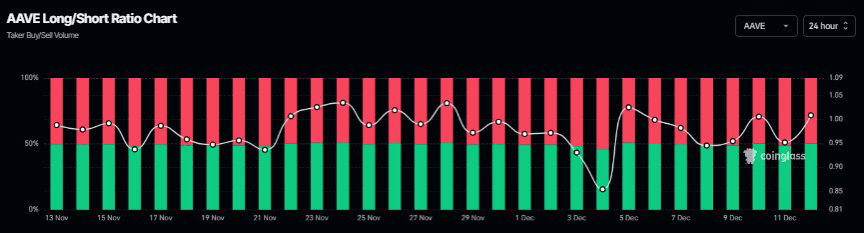
A chart of the long to short positions ratio for Aave. Source: Coinglass
Aave price forecast: Aave is approaching the upper limit of the trend, looking for a bullish breakout.
The price of $AAVE is trading within a descending parallel channel pattern (formed by connecting several highs and lows with two trend lines). At the time of writing this report on Friday, AAVE is approaching the upper limit of this channel, and a breakout above it would indicate a potential bullish reversal.
If buyers push the price above the trend line, the measured move - based on the channel width - suggests a technical target of $296.14.
The Relative Strength Index (RSI) on the daily chart reads 57, above the neutral level of 50, indicating gaining bullish momentum. Additionally, the MACD indicator has shown a bullish crossover, which is still in effect, further supporting the bullish hypothesis.
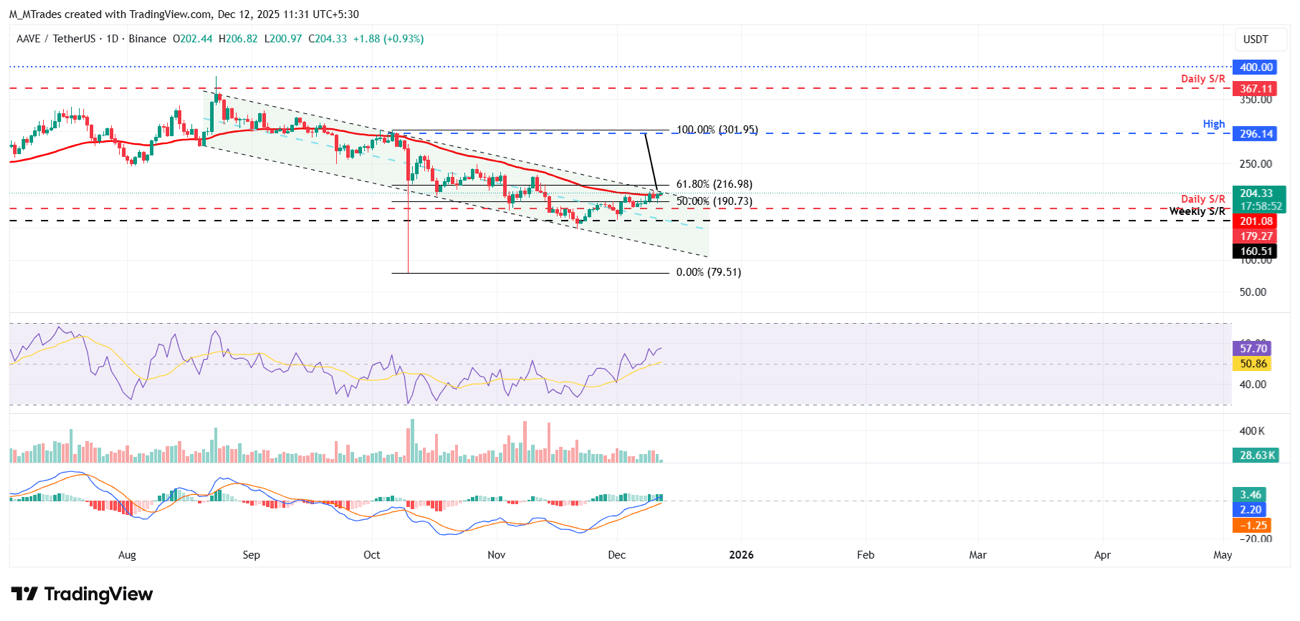
The daily chart of AAVE/USDT
Looking upward, if AAVE faces rejection from the upper trend line, the decline may extend towards the daily support level at $201.08.
#AAVE.智能策略库🏆🏆 #AAVE #BinanceSquare #BinanceSquareTalks #BinanceSquareFamily