

Litecoin is trading above $80 and is struggling to extend its bullish cycle within a larger descending wedge pattern.
Increasing bullish bets amid declining open interest warns of potential long squeeze.
Technical forecasts for Litecoin suggest that further extension of the reversal from the resistance level of $87 may be on the horizon.
The price of Litecoin ($LTC ) settled above $80 at the time of writing this report on Friday, after reversing from the resistance level of $87 on Wednesday. Derivative data indicates the accumulation of bullish positions while open interest for Litecoin futures declines, suggesting the risk of a long squeeze. Litecoin's struggle to surpass $87 may lead to a drop below $80 within a broader descending wedge pattern.
New bullish bets are at risk as retail demand declines.
CoinGlass data shows a generally stable movement in the open interest of futures contracts $LTC (OI), which stood at $397.18 million on Friday, down from $409.27 million the previous day. This reflects a decline in the nominal value of all active positions, including long and short positions, indicating a reduction in risk exposure among investors.
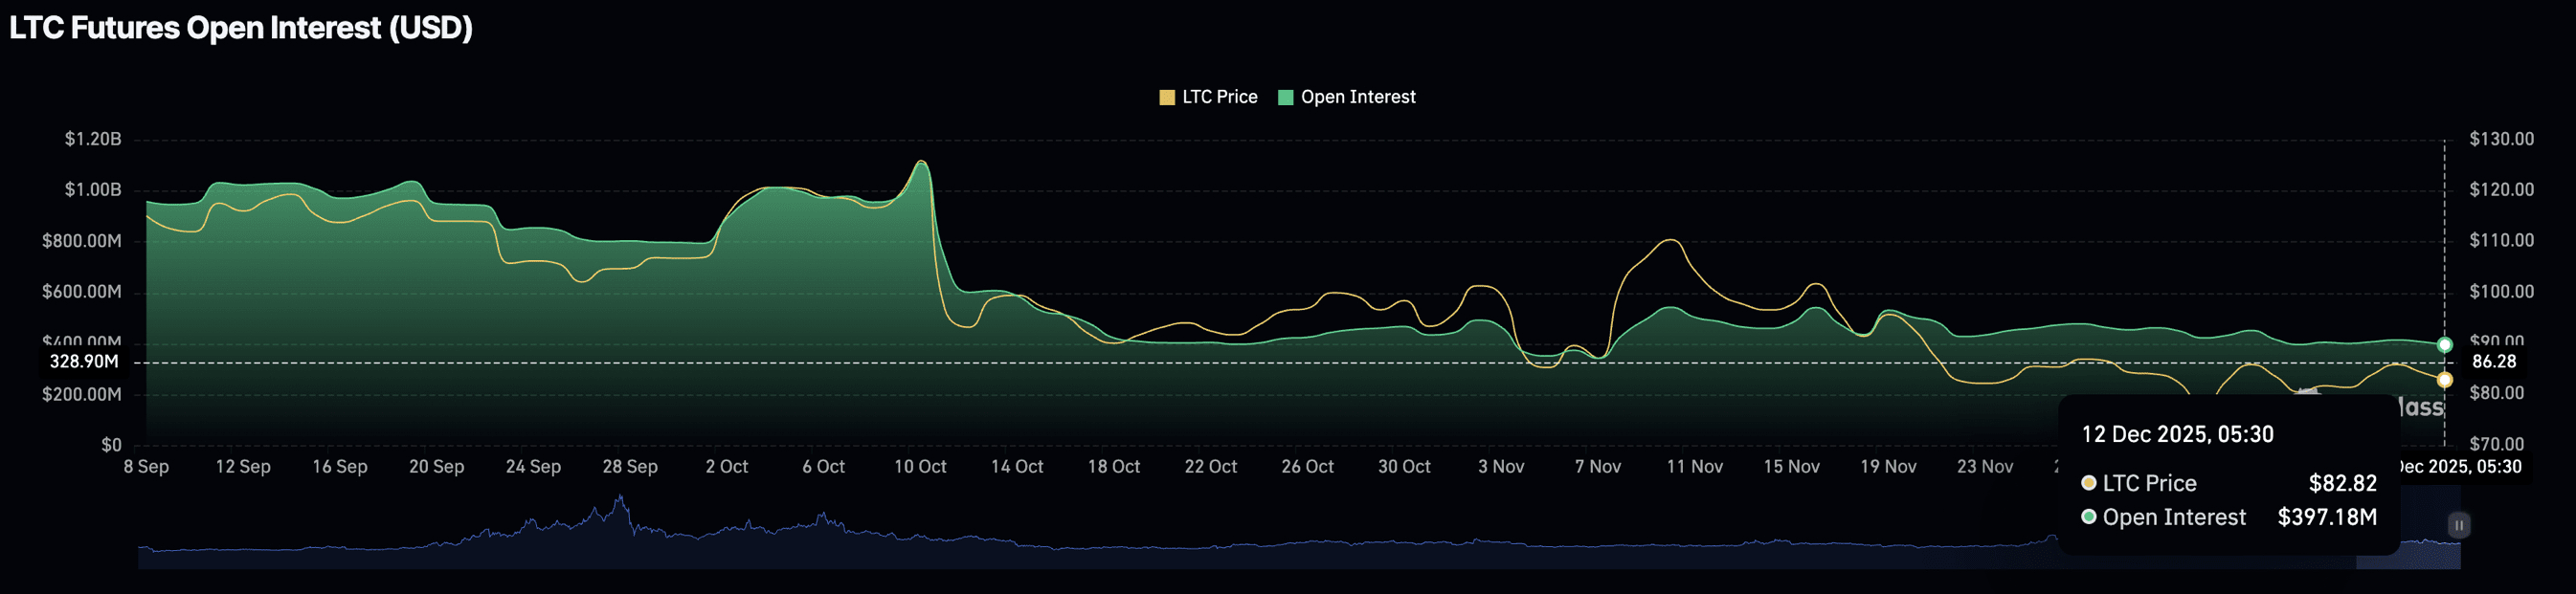
Open interest in Litecoin futures contracts. Source: CoinGlass.
In line with this, institutional interest in Litecoin is weak, as, according to Sosovalue, the LTC-focused exchange-traded fund (ETF) from Canary Capital has seen nine consecutive days of zero net flows.
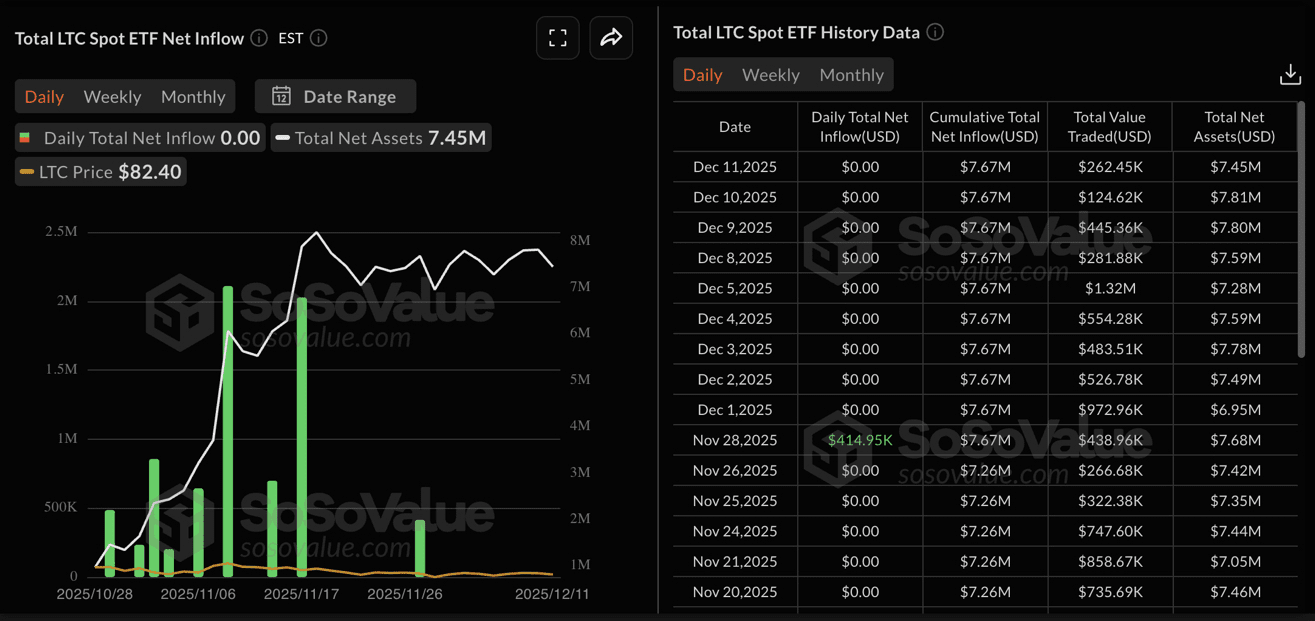
ETF data for LTC. Source: Sosovalue.
However, the funding rate weighted by open interest at 0.0071% indicates an increase in bullish confidence. Furthermore, the long-to-short ratio shows that 51.27% of all active positions are long positions, up from 46.68% the previous day.
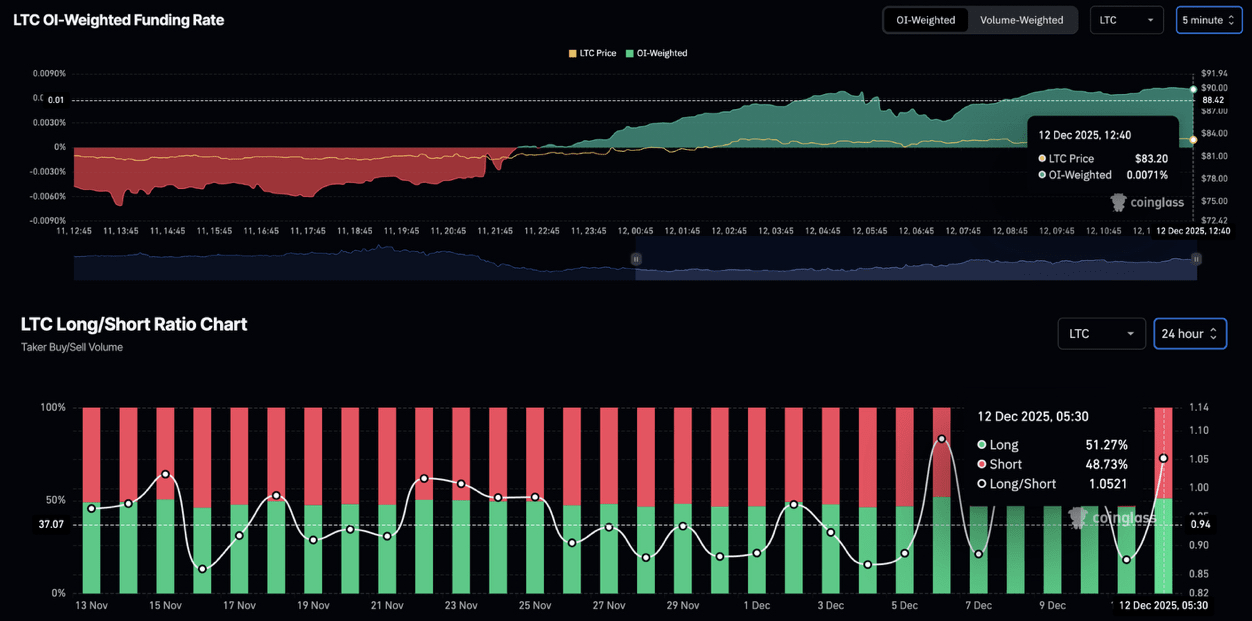
Litecoin derivatives data. Source: CoinGlass.
Typically, an increase in long positions during a decline in retail interest increases the risk of forced liquidation. Such market structures can lead to a cycle of declining prices and liquidation of long positions, known as long squeeze.
Litecoin may lose control above $80.
Facing $LTC difficulty in extending gains above the $87 level within a broader descending wedge pattern (formed by connecting two converging descending trend lines) on the daily logarithmic chart. The ongoing struggle exposes it to the risk of retreating below $80 to test the lower support line connected to the lows of October 17 and November 4, near the pivot point S1 at $70.
Technically, the momentum indicators on the daily chart are balanced near neutral levels. The Relative Strength Index (RSI) appears at 45, indicating room for a correction before reaching the oversold zone.
Additionally, the Moving Average Convergence Divergence (MACD) indicator is losing bullish momentum, nearing the signal line as the green bars in the histogram shrink. If the MACD crosses below the signal line, resulting in a red histogram bar below the zero line, it will indicate a bearish shift in momentum.
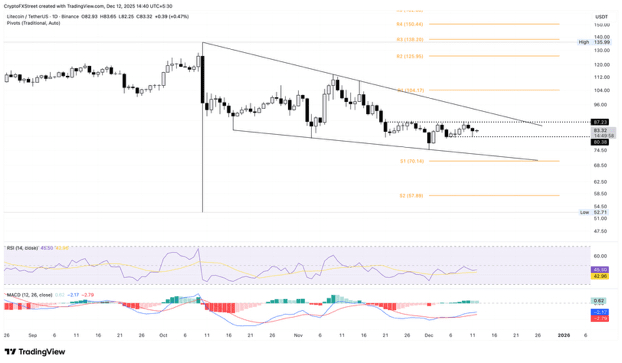
The daily logarithmic chart for LTC/USDT.
Conversely, if Litecoin breaks above $87, it may target the upper trend resistance line near $90. If LTC exceeds $90, the pivot point R1 at $104 could be the initial target.
#LTC #LTC.24小时交易策略 #BinanceSquareFamily #BinanceSquare #BINANCE