Unknowingly, I have been in this circle for over 10 years.
Before creating this new account, I thought a lot.
At 37 years old, looking back to 14 years ago when I just entered the market, the little capital I had was borrowed, 60000, I had no confidence at all.
Now the account has exceeded 8 digits, to be honest, my feelings are quite complicated. The earnings are not fast, nor are they based on luck; it's just stepping into pits one by one and reflecting on each pit to climb out.
I have done trading, really going from long-term to short-term, from ultra-short to intraday swings, I have tried various styles one by one.
Now you say I understand technology, but I'm not a top expert, yet I can really say that my understanding of losing money is deeper than most people.
In the past six years, I've seen too many people build skyscrapers only to see them collapse. Tens of thousands were invested, then tens of millions were invested, only to be wiped out in a single bear market.
Do you think their skills are bad?
No, they're just used to holding onto losing positions. When their luck runs out and they've used up all their funds, a single pullback wipes out their entire account.
Some people can win 100 times and recover, but if they fail just once, it's not just a small loss, it's all gone.
There's another problem that's really getting to me: way too many people panic as soon as they lose money.
He got carried away and wanted to recoup his losses, but his trading went completely wrong, and he ended up losing everything.
I'm not a saint; I make mistakes too. But I'm clear on one thing: you have to admit that the market won't listen to your commands.
Don't assume that "I think it's going to rise" means it will, or that "I judge this to be a bull trap" means it definitely will. If you're wrong, you should exit, not stubbornly hold on.
In the cryptocurrency trading industry, the essence is whether you can tolerate things, whether you can admit that you sometimes make mistakes, and whether you can operate within the rules.
To put it bluntly, it's not that you don't know how to trade, it's that you're unwilling to admit defeat, unwilling to acknowledge your mistakes, and greedy.
Stop calling yourself a "faith," with phrases like "just hang in there, things will get better." That's not faith; that's a gambler's self-deception.
Now that my assets have exceeded ten million, there's nothing to brag about. I simply perfected a simple set of rules:

Admit your mistake
Set a stop loss when opening an order
Make decisions when you're calm, and shut down your computer when you're overwhelmed.
You think making money depends on skills, but the truth is: every time you don't follow the rules, you're digging your own grave.
The market is still in good shape, and there are still many opportunities.
If you're willing to control your emotions and establish rules, you can turn your initial investment into wealth, even with only 10,000 yuan, let alone 60,000 yuan.
Without further ado, let's get straight to the point!
Today we'll talk about the most important technical aspects: support and resistance levels, and key support and resistance levels!
I will explain today's topic in six parts:
1. The difference between general support and resistance levels and key support and resistance levels
II. The Role of Key Support and Resistance Levels
Three: Five tips for identifying key support and resistance levels
4. Five common mistakes in identifying key support and resistance levels and how to avoid them.
Fifth: We'll guide you through hands-on practice in real trading, helping you identify key support and resistance levels.
6. How to deal with market reactions after major support and resistance levels: trend reversals, breakouts, and sideways consolidation.
1. The difference between general support and resistance levels and key support and resistance levels
I dare say that 90% of people in the current trading market don't know how to identify support and resistance levels.
Of the remaining 10%, 80% found the wrong support and resistance levels.
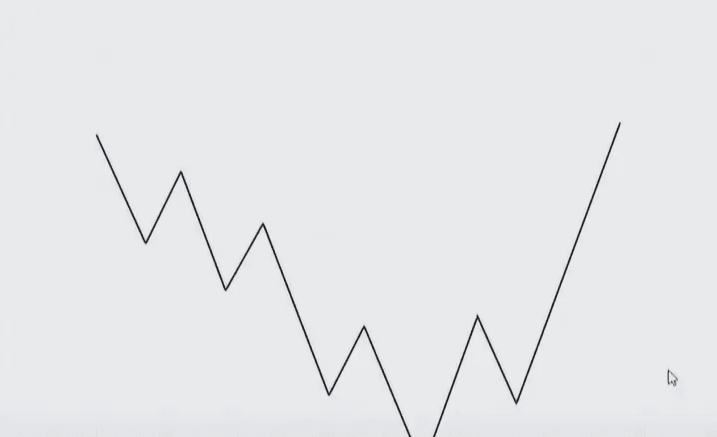
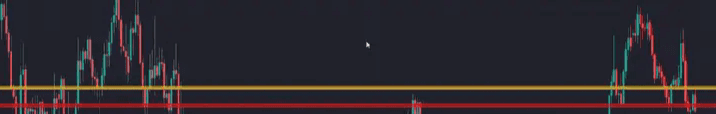
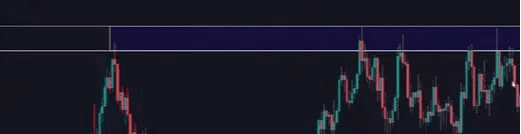
When people talk about support levels, they usually imagine it as a floor.
When prices fall to a certain level, opposing forces begin to emerge.
The downward momentum in prices weakened, and they began to move in the opposite direction.
The same principle
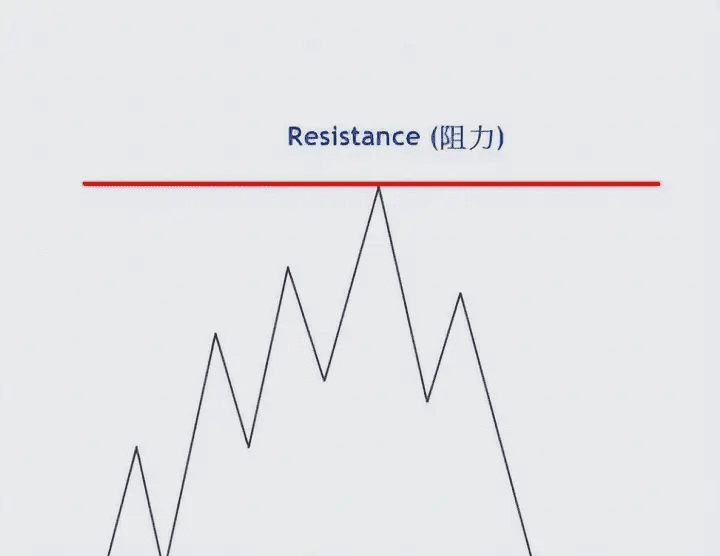
A resistance level is a point where, after the price rises to a certain level, opposing forces emerge, weakening the upward momentum and even causing the price to reverse. You can think of a resistance level as a ceiling that prevents the market price from continuing to rise.
The above is our understanding of support and resistance levels:
Isn't this concept simple? If you think so too, congratulations, you're one of that 80%.
The two scenarios listed above will repeat countless times on the trading screen every day.
If we enter the market too easily based on the price failing to break a certain support or resistance level once or twice, we are very likely to suffer a painful lesson.
Because you don't know that this position is a truly meaningful position for the market?
It's still some randomly generated noise, so at this point we need some more advanced techniques.
Those are the main support and resistance levels, which help us filter...
To avoid confusion
Next, I will explain the main support and resistance levels that this article will clarify.
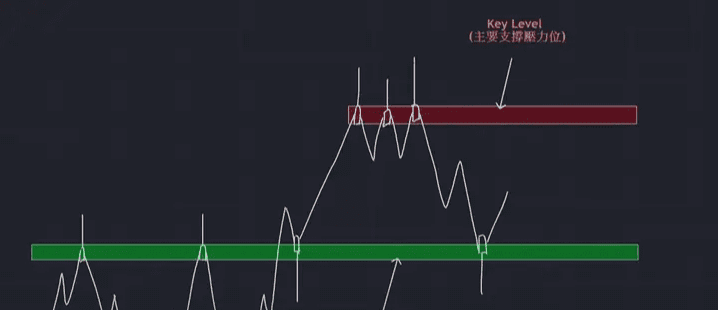
The term "key position" is abbreviated as "key level" in English.
Key levels are truly sensitive areas in the market. The market has shown its stance on them and reacted significantly to them; they have also been rejected by prices many times.
It may have been an enemy of the market yesterday, but today it has become a friend of the market.
Key positions are like magnets; there's an invisible attraction that keeps people trying to get closer to them.
If we can accurately identify it when the market approaches this level again...
We can then make a reasonable prediction about the future, that is, prices will react to some extent again.
This is our chance to enter the market and make money.
II. The role of key support and resistance levels:
So, what are the practical benefits of learning to find accurate key levels? How does it actually help us in trading?
We all know that there are two things that the vast majority of traders do wrong, and these are the biggest and most fatal mistakes.
First, it's unplanned, random market entry.
Second is chasing highs and selling lows.
I will explain each of the above two points with a story.
The first type: entering the market at a certain position without a plan or by chance.
Imagine you are a sniper. From the moment you receive the mission, you would have to formulate a comprehensive plan.
For example, choosing a sniping position and understanding the target's habits and behavior.
What equipment do you need?
Your entrance route
Your escape route
You need to observe your surroundings.
The disguises you will use
And you need to patiently wait for the target to enter your firing range.
The same applies to trading; every successful trader...
Before each trade, there is a comprehensive plan, rather than entering the market aimlessly and randomly.
Key levels are excellent entry points for deployment and attack, because the market often reacts significantly at these key levels.
This is where you have the best chance to capture the next big trend in the market; all you need to do is formulate your trading plan here.
Formulate a series of ifs:
If the price really does return to this level...
If a reversal candlestick pattern appears here...
If a double top pattern forms in the price here...
If there is enough profit margin before the next key level...
If the price goes there
I'm going to take profits!
If the price is wrong
If you get here
Then I need to cut my losses.
You should make the above plan before each transaction.
Good coordination with key positions
This top-notch strategic deployment location
Your chances of success will naturally be much greater!
The second
It means chasing highs and selling lows.
Have you ever played the game "Monkey Steals the Ball"? The rules are very simple.
It's basically one person playing the role of the monkey, while the others pass the ball around the monkey.
At this time
The monkey has to keep running around.
Go steal the ball
。。。
Those who have played this game and been the monkey should know very well.
Every time you run to the ball, it gets passed to the other side, and you have to run all over again.
In the trading market, if you aimlessly chase after the price of a coin...
You're essentially playing the role of the monkey; every time you see the price go up...
You feel that this is an opportunity you can't miss and you have to rush in immediately.
But by the time you get on the court, the ball has already been passed to someone else, which is after you've made your cut-loss play.
Then they continue walking in the opposite direction; I believe many people have encountered this situation.
You might feel very discouraged, as if you'll never be able to win this game.
The only solution to get out of this predicament is to let go of your agitated emotions.
And the plan to chase the ball, combined with the sniper example mentioned earlier, to formulate a trading plan.
Instead of chasing the market, wait for the market to fall into your trap, and only act when the opportunity is right. This naturally increases your chances of winning.
Therefore, another significance of key levels is that we no longer need to chase prices, but instead deploy our strategies, wait for prices to return, and look for a high-probability entry signal.
When you repeatedly do this, combined with proper risk management and the right trading mindset...
I believe you will be more successful than 90% of people in the market.
Three: Five tips for identifying key support and resistance levels
So how can we correctly identify key levels in a candlestick chart?
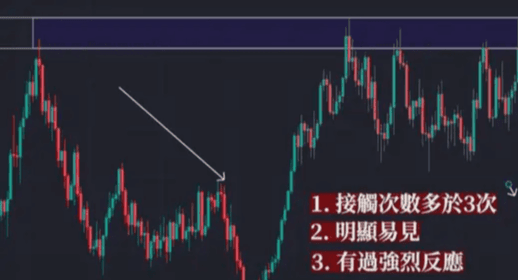
Remember these 5 conditions
1. The more contact the better.
2. Had a strong reaction
3. It is very clear and easy to see at a glance.
4. Has been rejected multiple times
5. Simultaneously passing through both support and resistance levels
All five conditions above do not need to be met for a position to be considered a key position.
However, the more conditions are met, the more powerful and effective that position is.
Next, I will break down the above 5 points step by step:
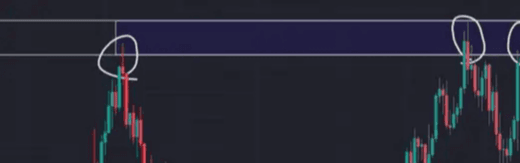
The more contact the better
There's a simple way to determine if a price level is a key level: the number of times it's touched by the market.
In our daily lives, if you find that a situation keeps repeating itself, you might think it's just a coincidence once or twice, but when it happens a third or fourth time...
Do you find this matter quite suspicious? It seems as if this happened with some purpose or reason.
At the same location, at different times, the price failed to surpass this level several times.
If a price has encountered resistance or support at this level, we might wonder if this level has any special significance for the market.
Is this position a crucial one? Is it the high or low point for this year?
In summary: A price level reacting to a price line once or twice might just be a coincidence, but when this happens frequently, the probability of it being a key level increases significantly.
There was a strong reaction
We know that history always repeats itself. If prices don't react strongly after reaching a certain level, how can we reasonably expect prices to react significantly again at the same level in the future?
The market, like humans, has a memory, but we usually only remember the things that left a deep impression.
Everything is based on one concept: reasonable expectation, when the market returns to a level where it previously surged or plummeted.
We have a reasonable suspicion that prices might repeat themselves, reacting significantly at the same level, and that significant reaction would represent our profit margin.
In fact, many orders placed by investment institutions had already been placed in this location.
When the price returns to this key level, there will be a chance to trigger their orders.
If we, as retail investors, temporarily align our views with those of institutional investors at this point, the price will quickly move in the direction we desire.
Move away from your stop-loss and towards your profit target.
As the saying goes, "Follow the big players, and you'll have a bull market every day."
This is one of the key principles of market manipulation I've learned over my years of experience in the financial industry.
It's very clear and easy to see at a glance.
A good key position has one condition: it must be very clear, very specific, and easily visible at a glance.
Imagine one day you open a chart and find a position that seems like a key level, but also doesn't.
If you see the price trying to find resistance or support at a certain point, and the price seems to react, but not significantly, then...
I urge you to give up this position immediately! Right now! Immediately!
Even if you manage to find a reason to consider this a key position, your confidence in this position is already being affected without you realizing it. Why?
Because when a trading signal actually appears, you will definitely hesitate, which will greatly affect your trading decision.
Even if you actually enter the market, you'll get very scared if the price line moves even slightly in the opposite direction.
Even if you have a very strong WeChat account that prompted you to make this transaction, you might still doubt your position.
And by giving up that crucial position too early, you were forced to leave the game prematurely.
If you abandon your original trading plan, the trade will fail, and you will have failed to uphold the fundamental principle of consistency.
This market has no shortage of trading opportunities. There are over 200 currency pairs available for trading in the cryptocurrency market, as well as various forex, futures, and securities products.
I'm never afraid of you missing an entry opportunity; what I fear most is entering the market without following your established trading plan and lacking confidence.
Rejected multiple times
When pursuing a girl, the most painful thing isn't being rejected by the one you like, but being rejected relentlessly by the one you like.
。。。。。。
Finding key levels follows the same principle. We need to find the pain points in the market; we would like to see a certain position that has been repeatedly identified at different times.
Alternatively, by repeatedly experiencing a rejection, each repetition of this reaction increases our chances of entering the market.
Simply put, you'll see candlestick patterns appear around this position, with one or several consecutive long upper or lower shadows, and the price tends to move in the opposite direction each time it's rejected.
This means that prices have repeatedly expressed their intentions to the market, rising or falling multiple times, but each time the market rejected them, immediately pulling them back by opposing forces.
This situation indicates that a strong force is guarding this position.
Whenever this happens, especially when the daily price successfully breaks through this area, we consider it a strong and effective key level.
Both support and resistance levels have been tested.
In the world of trading, there are no permanent friends or permanent enemies.
One scenario we would like to see is that yesterday's support level becomes today's resistance level.
Or perhaps yesterday's resistance level becomes today's support level; whenever the price breaks through the previous resistance level...
Often, the price will return to the same position and bounce back again.
If the price is rejected at this point, it means that yesterday's resistance has turned into today's support.
This situation also indicates that this position carries considerable influence in the underworld; both the legitimate and criminal worlds treat him with respect.
In other words, both the bulls and bears have held this position at some point, and every time we see a certain position...
If a price level has both support and resistance levels, we can generally determine that it's a key level, and we're fairly certain we're on the right track.
After explaining the conditions of the five key bits, I will now explain five aspects related to applications.
Here are some common mistakes that many cryptocurrency enthusiasts make, along with some useful tips.
4. Five common mistakes in identifying key support and resistance levels and how to avoid them.
Five common mistakes in finding key positions, and how to avoid them.
1. Too many lines drawn
2. Reckless entry
3. It is a region, not a line.
4. The scope is too large.
5. Longer timeframe charts are more accurate
Too many lines
When it comes to finding key levels, the first common mistake is drawing a line through all the so-called support or resistance levels seen on the chart.
The more lines you draw, the more trading opportunities you have, and the more money you will make.
Because many of the lines you draw are just market noise.
Based on the five conditions mentioned earlier, many of these are not considered qualified key positions.
If we arrange the charts like this, it will only confuse us and affect our trading decisions.
Everyone should know this principle:
The key to analyzing charts is to keep them simple and clear, ensuring we can clearly see price action. Our primary focus is on observing price reactions.
If too many things obscure the candlestick chart, causing us to be distracted or hesitant, then we are definitely putting the cart before the horse.
Therefore, we only need to focus on the most obvious, important, and closest major support and resistance levels.
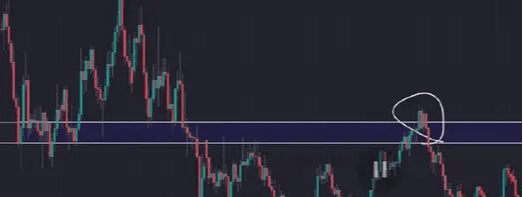
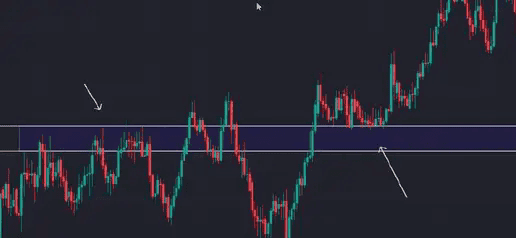
Reckless entry
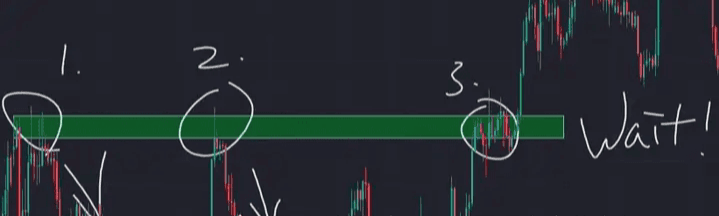
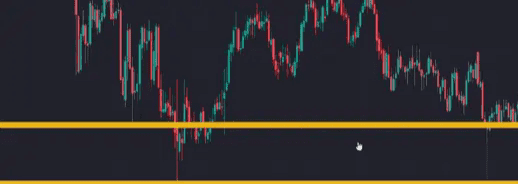
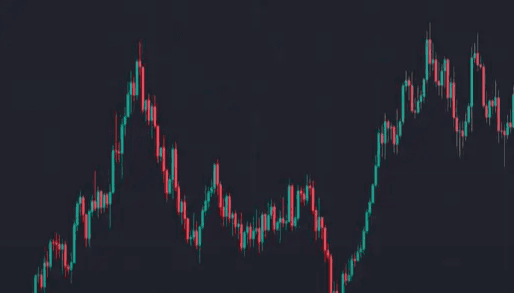
The second point is reckless entry. Let's take a look at an example from a real trading session. When we find a key level (as shown in the figure)...
We saw that the price reacted strongly downwards when it touched this level last time, and now it's back here. Don't assume the price will fall again and immediately enter a short position.
Doing so will likely result in a painful lesson.
As we just mentioned, there are no permanent enemies, let alone permanent friends. Yesterday's resistance level could very well become today's support level. Key levels are essentially the equilibrium points of the market.
Both the bulls and bears will want to make a breakthrough or hold their ground here, so their forces usually clash at this position.
What we need to do is wait for the market battle to unfold and observe how prices react to this level.
Should we decide whether to enter the fray based on the traces left by the two sides during their encounter?
Why enter the venue?
When should we enter?
When are you leaving?
A series of trading plans, etc.
Simply put, the best approach is to wait for a trading signal as confirmation before entering the market.
This signal can be a technical indicator, a chart pattern, a candlestick pattern, or even fundamental analysis.
There are over a thousand different combinations that can be used as trading signals.
Due to space limitations
I can't possibly cover everything in this one article.
Therefore, this matter will not be explained in detail here today.
I will only briefly discuss two or three trading signals in the last part of this article.
In the future, I will write more detailed articles on different entry signals.
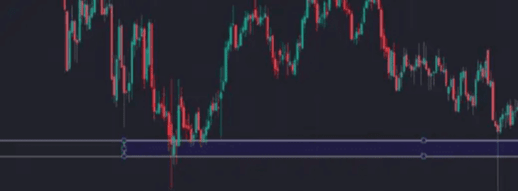
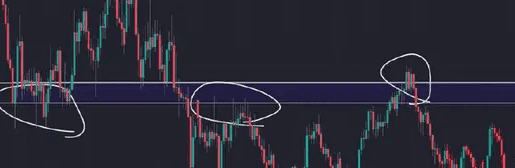
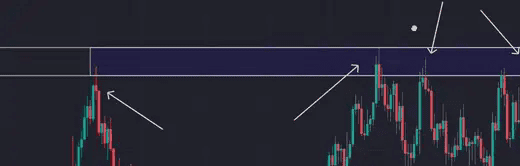
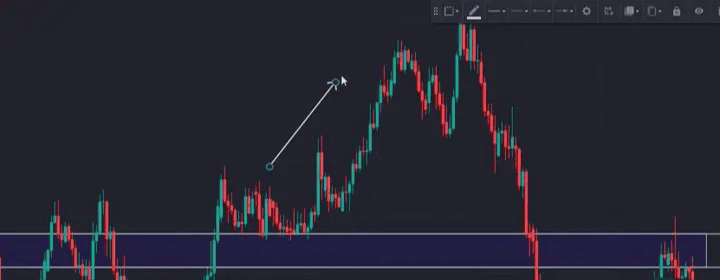
It's a region, not a line.
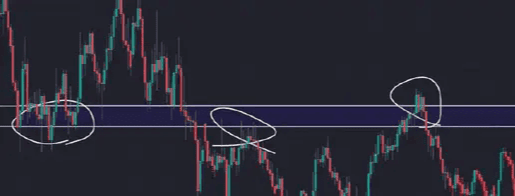
We'll continue by explaining the third incorrect usage: the true key point should be an area, not a line.
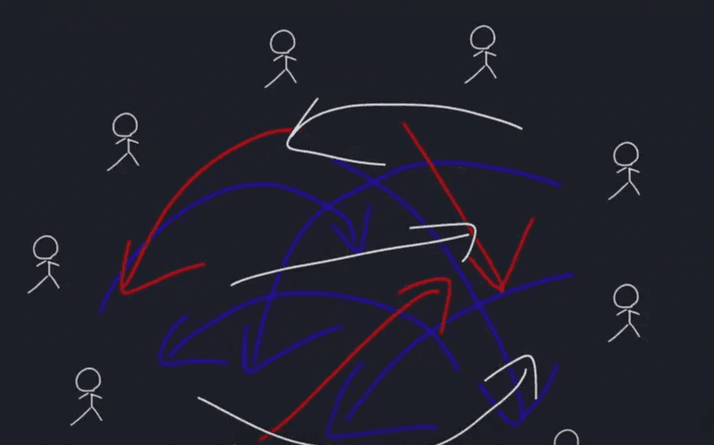
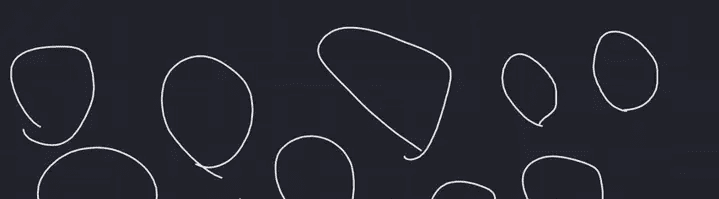
While the market does repeat itself, the process is never 100% identical each time.
Market cycles are like the circles drawn in the diagram above. Each circle will have some differences, and it's rare to draw identical circles. This isn't because I intentionally didn't draw them that way.
Rather, the market is fraught with uncertainty. Although the results may be similar, there is an extremely low probability that the process will completely replicate the previous one.
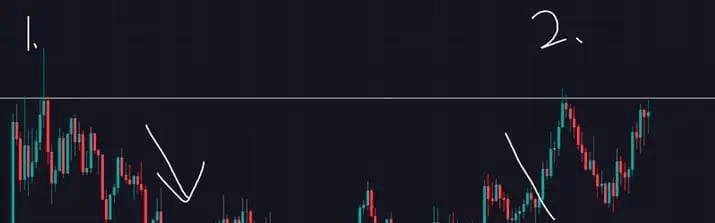
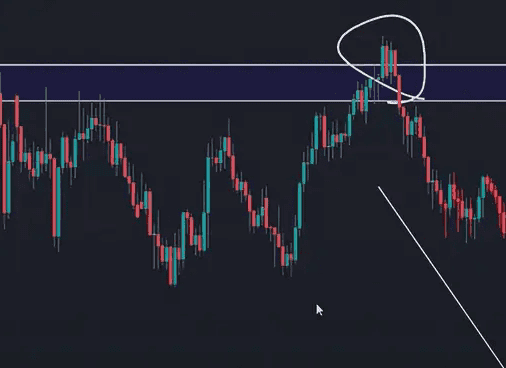
Taking this as an example, the price rebounded again after reaching this level for the second time. When it returned to this level for the third time...
Based on your analysis, you decided to enter the market with a stop-loss order placed at the previous retracement level. However, today the price decided to drop further, hitting your stop-loss level directly.
If you draw this key level as a zone, your stop-loss will be set here, and your trade will be successful, bringing you substantial profits.
The difference between a successful and a failed trade is just a tiny area.
Drawing key levels as a region can help us avoid many losing trades.
At the same time, it can drive the price down to our profit target, which is the direction we want, greatly reducing the chance of an unexpected exit.
I believe that those who trade contracts will deeply resonate with this: the overall market trend hasn't changed at all, and it's still developing according to their expectations.
Because of that wretched needle, my account was wiped out.
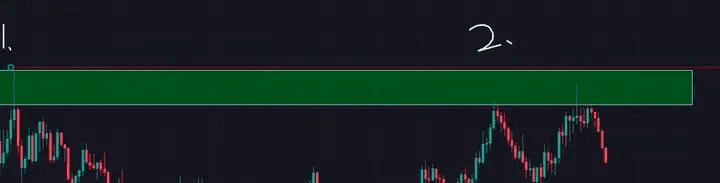
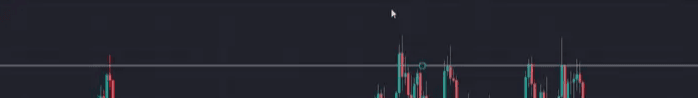
The scope is too large
Sometimes we find that the drawn key area is very large.
This situation is more likely to occur over large intervals.
As shown in the chart, a trading signal has appeared within the candlestick chart. Normally, if a signal appears at this position, there is sufficient reason to enter a trade.
However, because the area we are drawing here is too large, it makes us hesitate.
A field that's too large can leave us feeling lost. Even with clear signals, unnecessary worries can arise, causing us to hesitate and miss opportunities.
When this situation arises, we can connect as many points on the physical line as possible to narrow down the area to a reasonable range, while ensuring at least three points of contact. This will make the entire situation much clearer.
Larger timeframe charts are more accurate
Larger timeframe charts are more accurate; you've probably heard that the larger the timeframe, the more accurate the chart.
The logic is quite clear: the more time you spend developing, planning, and preparing for something, the higher your chances of success will be compared to if you do it in a very short time.
Impromptu events tend to have a much higher chance of success. When we look for key levels, we always start with a larger timeline.
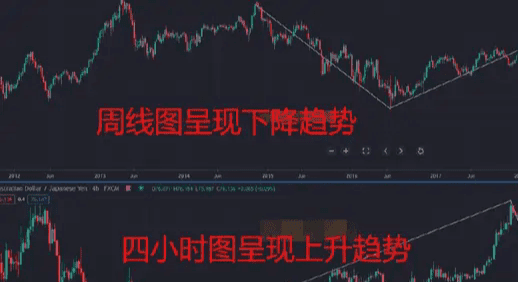
Here, I'd like to share a chart analysis technique I've used for many years, which was taught to me by a trader from a well-known institution.
From weekly charts to daily charts, then to 4-hour charts, and then 1-hour charts, it goes down layer by layer.
Analyzing any currency pair always starts with the larger timeframe chart to develop a trading plan for the following week. Once you understand the major market trends...
Your chances of being on the right side will naturally be greater.
If you have limited trading experience, I suggest you start with larger timeframes, such as daily or even weekly charts.
First, build your confidence in trading, then gradually try it on smaller timeframes.
Fifth: We'll guide you through hands-on practice in real trading, helping you identify key support and resistance levels.
Now I've finished explaining the five conditions for defining key positions, as well as five common mistakes and tips in application. You might feel that what I just said was somewhat subjective, and it's difficult to define them with clear, quantifiable conditions.
For example:
What constitutes a strong reaction? How many rejections are needed to be considered "multiple"? And how many rejections are needed to be considered "effective"?
If you also have this question, congratulations!
Your comprehension is amazing!
You have likely already begun to absorb and digest this concept.
This is why I categorize this course as advanced technical analysis.
Indeed, the concept of a key position is very subjective.
Technical analysis, including all price action, involves showing the same chart to different people.
The results may vary, so the only way is to perform backtesting yourself.
Practice more and observe charts more.
Don't just think about it, take action! Next, I'll show you a few examples so you can put what you've just learned into practice.
OK!
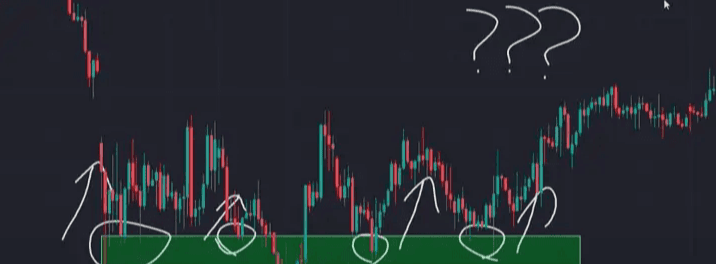
Before looking at chart examples, I first need to teach you how to draw a key position.
Step 1: We draw a line to mark the area where the K-line touches the most.
This line will follow one principle: the body is more important than the lead wire.
Why?
Because we need to focus on the price at the end of the candlestick chart—the result. The leading edge (or trailing line) represents what happened, not the result.
Step 2: Draw two more lines above and below the previous line; the goal of these two lines is to touch the candlestick as many times as possible, whether it's the body or the trailing line.
Step 3: Delete the middle line
This will give you a preliminary key region. If this region is too large...
You can adjust it according to the secret I just mentioned, based on the principle of connecting to the point of maximum contact.
Remember this principle: the entity is more important than the lead! If there is a conflict between the entity and the lead, we will choose to sacrifice the lead!
Next, we'll officially begin looking at some chart examples.
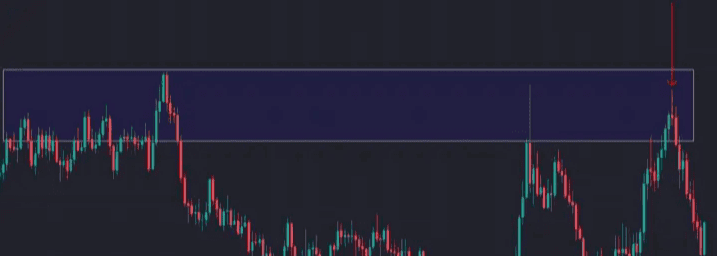
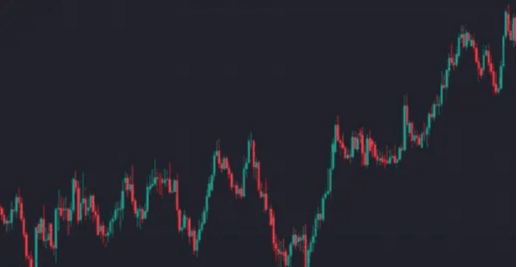
In the first candlestick chart, can you guess where the key level is? And how many conditions does it meet simultaneously?
That's right! This is it!
First, we draw a line, trying to make it touch as many entities as possible.
Then draw another line above and below it to form a first draft.
Finally, let's make a slight adjustment; this area is the key position.
Do you see that this position is a bit out of bounds? For us...
It's actually acceptable, because markets are usually not perfect, and the probability of things going like what's depicted in some books is very small.
As long as the flaw isn't too significant, it won't affect his eligibility for a key position.
This position satisfies three conditions.
First: It had at least three contacts.
Secondly, we have all seen that prices have reacted strongly in the past.
Thirdly, it has acted as both a support level and a resistance level.
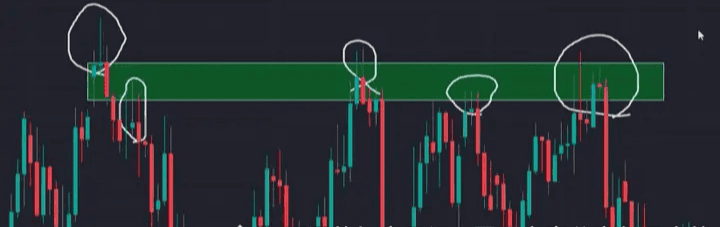
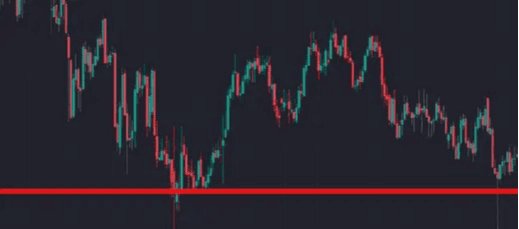
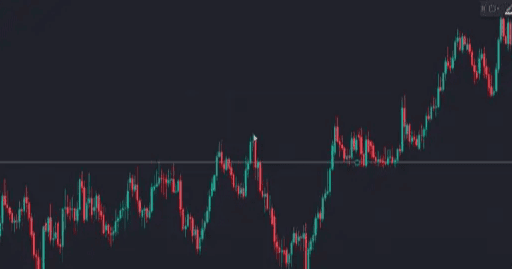
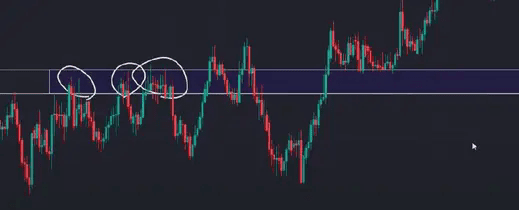
Okay, let's strike while the iron is hot and look at the second candlestick chart.
Let's try to find the key position together.
The same drawing method
Step 1: Draw a line that connects to as many entities as possible.
Step 2: Draw another line above and below it; this will give us a preliminary key position.
Step 3: Let's make a slight adjustment; this key position now meets four conditions.
First, it had more than three contacts; second, this position is very obvious and can be seen at a glance.
The third one had elicited a strong reaction more than once.
Fourth, we can see from candlestick patterns that the price has been rejected multiple times.
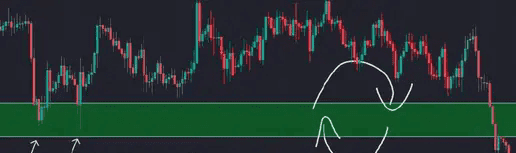
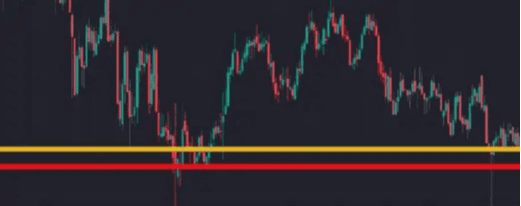
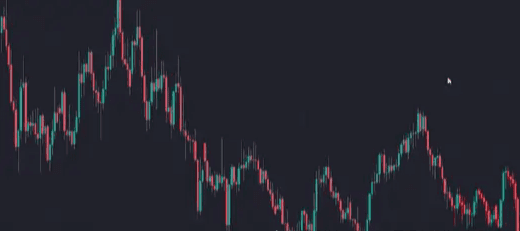
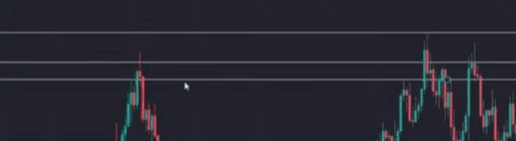
Okay, enough is enough! Let's do one last set of exercises. This picture looks a bit difficult.
First, we draw a line that touches all the entities, and then draw a line above and below it, and another line below it.
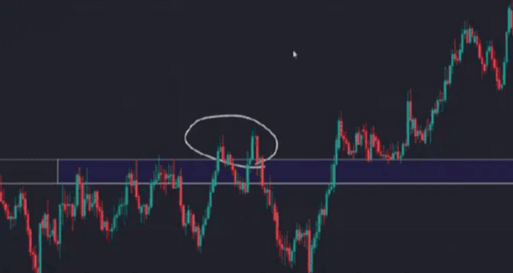
Okay, here's the problem! What if we encounter another situation where someone crosses the line?
I'll define this as a false breakout event here. I'll explain what a false breakout is later. Generally, I ignore false breakouts because I don't want to overstate the range.
I've emphasized many times that key positions are very subjective; every chart and every person's perspective may be different.
What you need to do is believe in yourself. This article I'm writing today will guide you into the world of advanced technical analysis.
However, this matter cannot be fully understood through a single article.
To achieve a thorough understanding, you must spend the time to figure it out yourself.
Observing and trying things out doesn't just refer to key levels; it applies to the entire world of trading.
There are countless ways to win money, as long as you've tested them yourself, verified them, or firmly believe they're feasible.
Then it will work; believe in yourself.
You will succeed at anything when you do it to the best of your ability. Don't let a few words from others sway you!
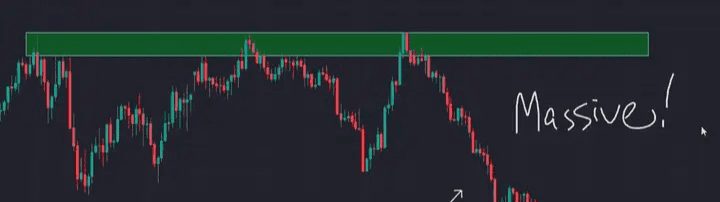
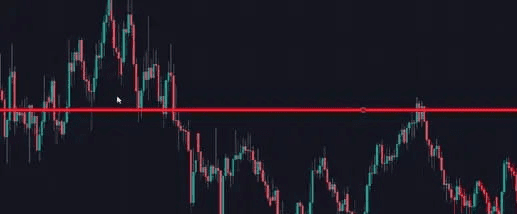
Okay, let's continue. This is a very strong key position.
It satisfied all four conditions at once:
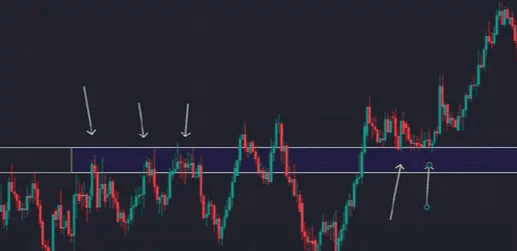
Its contact occurred more than 3 times in a row.
He has also worked on support and resistance levels.
There was a strong reaction before.
It has also been rejected many times.
Six: How to deal with market reactions after key levels: trend reversals, breakouts, and sideways consolidation.
First: Transactions are time-sensitive.
The cryptocurrency market is constantly changing. Even if I've given you the exact entry point, things can still change if the price action doesn't go as I predicted.
I need to tell you to close the position immediately, from writing to publishing, to reviewing, and then you pick up your phone.
There are too many uncertainties that could delay the opportunity.
Second: Challenging human nature is difficult.
Humans are greedy, including myself.
Many people could clearly make money while trading, but they complain that they're not making enough.
You earn 5%, then wait for 10%; you reach 10%, then wait for 50%; and once you've reached 50%, you want to double it to 100%.
As a result, after the waterfall, the loss became -30%.
Finally, seeing that things weren't going well, I decided to close the position and exit with a smaller loss. I believe this kind of thing happens every day.
Therefore, I advised you to set a profit target and take profits quickly, practicing planned trading. Very few people can actually do that.
If you make money, that's fine; you might even appreciate my kindness. But if you lose money even once, then I'll have to bear the title of a master conman.
The truth is, out of 100 trades, I let you win 99 times and only lose 1 time—that's human nature.
Third: I don't know you
My sharing is purely out of interest. I have already achieved financial freedom through the stock market, and I don't need to prove anything to anyone.
I don't need to put pressure on myself by helping others make money. What does it matter to me whether you make money or not? What does it matter to me how much money you want to make?
Fourth: Give a man a fish and you feed him for a day; teach a man to fish and you feed him for a lifetime.
This is also one of the most important reasons why I write and share.
Mr. Lu Xun abandoned medicine for literature
Claiming that studying medicine cannot save China
Because I want to improve my health
First, improve mental health
Even now, people from all over the world continue to provide aid to Africa, donating money, supplies, and personnel.
The amount increased year by year, but it was discovered that the more they donated, the poorer they became.
I believe you, the reader, are also a sufficiently intelligent individual, because those who understand the cryptocurrency world and dare to venture into it are undoubtedly among the most outstanding elites in this society.
So what I hope to teach you is the technology, the fundamentals, so that you can integrate them using your own independent thinking ability.
Develop your own trading strategy and stop being at the mercy of others.
all in all
Next, I will talk about
Its value will definitely be greater than a trading strategy.
Typically, after prices pass a key level...
You will mainly see three types of results:
1. Trend reversal
2. Breakthrough
3. and sideways consolidation
We'll start with trend reversals.
Generally speaking, there are three signs that indicate a price reversal, potentially leading to a significant trend change.
First: The price was rejected.
The most typical example is candlestick patterns, such as the shooting star or hammer candlestick. As mentioned earlier, these patterns indicate that the price has tested the upside or downside.
However, it is immediately pulled back by the opposite force, which is a very classic, simple and effective reversal candlestick pattern.
Besides patterns like the Shooting Star, we can also use a simpler method to help us identify them: the RSI indicator.
Don't underestimate the usefulness of things like Shooting Star and RSI indicators.
Any candlestick pattern, chart pattern, or technical indicator will have its accuracy greatly improved if it occurs at a key level!
Let's look at some examples:
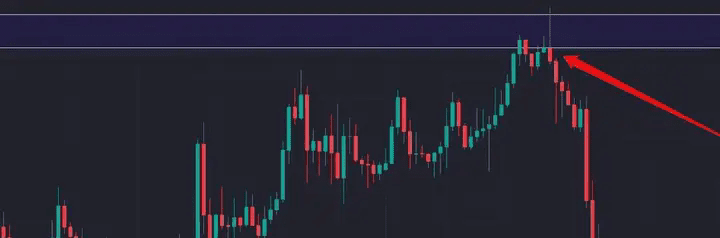
Let's look at this key level. The price attempted to test the upward direction and break through the resistance level, but immediately encountered resistance from the opposite side.
The candlestick chart formed a shooting star pattern, with increasing opposing forces that outweighed the upward breakout, ultimately reversing the entire trend.
Let's look at another example in the opposite direction. We see that when the price enters a key level, upward momentum begins to emerge.
We see a long lower shadow below the body of the candlestick, forming an inverted hammer pattern. This long shadow represents the downward center of gravity, indicating that the downward force has lost control.
It cannot continue to fall until the candlestick closes.
When the power of the two sides is out of balance, the price naturally moves in the direction of the one with control.
Of course, the RSI indicator can also be used as an entry signal. Let's see how it actually works in practice.
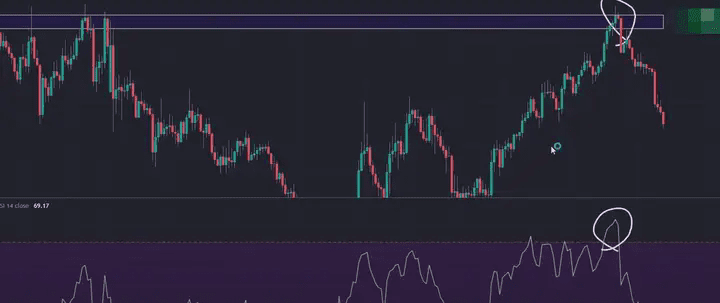
When the price reaches a key level and the RSI indicator rises above 70, it means the market is in an overbought state, which is a sell signal.
When the RSI flashes a signal at a key level, it indicates that the current trend is about to change.
Or at least a downward retracement is expected, which naturally results in a much higher success rate for the signal compared to a random, insignificant position.
Therefore you must remember all technical indicators and...
Candlestick patterns should never be used alone; many people have lost a lot of money because of this.
All trading signals must find a common ground. This can be achieved through different patterns, technical indicators combined with chart patterns, chart patterns combined with candlestick patterns, support and resistance levels, trend lines, or fundamental analysis. This approach will increase your trading win rate.
Financial trading is a game of probability. Whether you're trading options, US stocks, or cryptocurrencies, you need to understand this to have a chance of survival. This is absolutely the watershed between successful and unsuccessful traders.
Having discussed the first one, let's move on to the next two.
The next two concepts are more complex because they aren't immediately apparent. Instead, they involve trading by observing price action, as the momentum of the candlestick chart itself can provide clues, allowing us to gauge the likelihood of a trend reversal.
The first point is to observe how the price approaches the candlestick pattern.
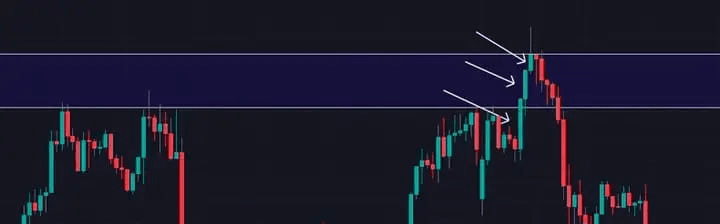
Let's look at this example. We see that when the candlesticks approach the resistance level, each one gets smaller than the last.
This signifies that the upward momentum is beginning to weaken, and also hints at something else entirely.
There is a consensus among buyers:
Okay! Listen up, guys! We've reached a point where we should stop here. It's not worth pushing any higher. Let's just make a show of it! Once the market shows a reversal signal, the price will immediately start to fall.
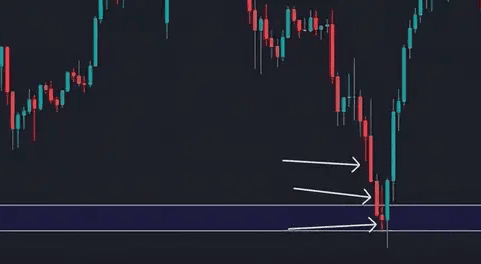
Conversely, when approaching a major support level, the candlesticks will inevitably become progressively smaller, indicating that the downward pressure is gradually weakening before a rebound occurs.
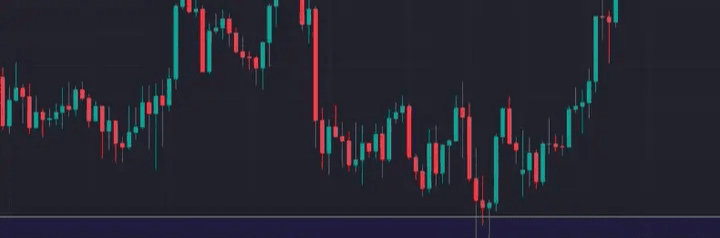
Second: The number of callbacks is increasing and becoming more frequent.
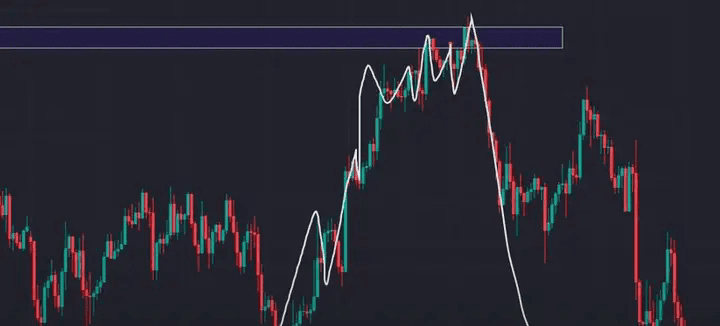
Let's look at this example. When the price goes up, things initially go very smoothly.
As the price approaches a key level, pullbacks become more frequent and more frequent, and we see the price starting to lack direction, fluctuating within a narrow range.
What does this imply? It means that opposing forces are beginning to emerge! They are engaging in a fierce struggle here.
Although we see that the buyers still have control for the time being, it feels like they are on the verge of collapse, and even when they are close to a key level, which is the buyers' profit-taking point, the price immediately reverses.
So that concludes today's technical sharing. I believe those who have read this far have found it helpful.
You're sure to gain a lot, just like taking a very valuable university course.
If you found this article helpful, please like, save, and share it with your friends and family so you can easily find it on your phone later when reviewing it!
The path to enlightenment in cryptocurrency trading is the same: from seven losses to two breaks even and then one profit. It all comes down to maintaining focus and not being greedy for various profit models; sticking to one trading system, and over time, that system will become your ATM.
Wenjing is focused on spot trading of Ethereum futures contracts; the team still has spots available, so get on board quickly! #加密市场反弹 $ETH

