📈 Technical Analysis of Chainlink (LINK)
Based on the price chart provided for Chainlink (LINK).
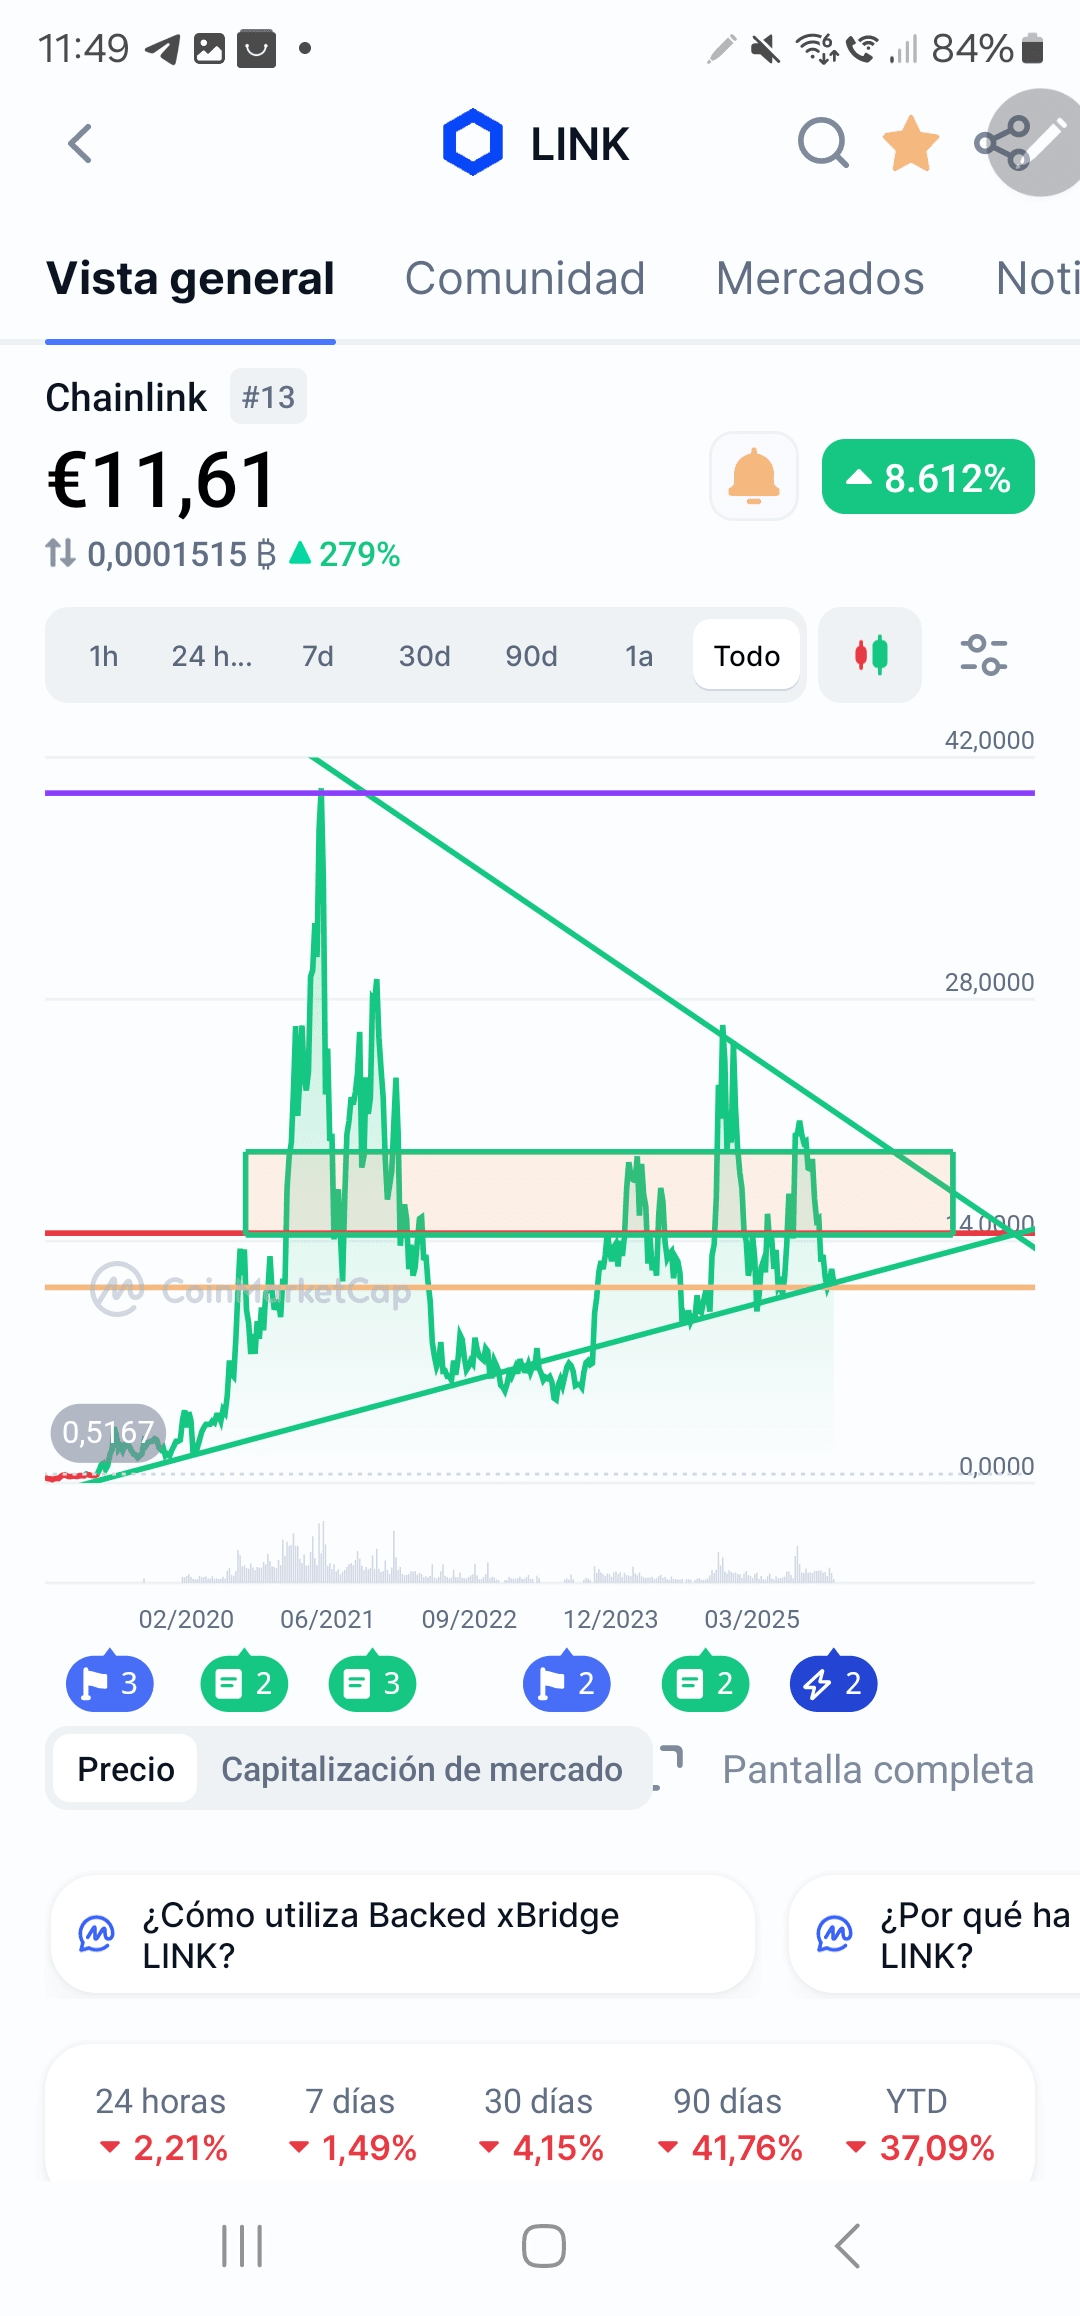
Identified Chart Pattern: Symmetrical Triangle
The dominant pattern observed in the long-term chart is a Symmetrical Triangle, formed by two converging trend lines:
* Upper Resistance Line (Bearish): Connects the highs since 2021 (the historical peak) and the subsequent lower highs, indicating decreasing selling pressure.
* Lower Support Line (Bullish): Connects the higher lows since 2022/2023, showing that buyers are stepping in at progressively higher prices.
This consolidation pattern, marked by the convergence of supply and demand, signals a period of indecision in the market. A decisive breakout above the resistance line or below the support line will trigger the next significant move.
Pattern Implications
* Breakout Target (Potential): The theoretical target of a breakout is calculated by adding the height of the widest part of the triangle to the breakout point. Since this triangle encompasses the all-time high, a bullish breakout could indicate the start of a new phase of significant growth.
* Key Zone: The vertex of the triangle is approaching the zone of €28.00 and the historical resistance close to the high. The breakout of this resistance would be an extremely bullish event.
🚀 Potential Projection for LINK in 2026
The projection for 2026 will depend on the direction of the breakout of the Symmetrical Triangle, assuming a favorable macroeconomic context for risk assets and continued adoption of Chainlink's oracle technology.
✅️Bullish (More Likely) | Decisive breakout above the resistance line (> €28) | €50 - €100+ | A bullish breakout of the long-term pattern, combined with the fundamental utility of LINK in DeFi and the Web3 ecosystem, could drive the price towards new all-time highs. The price projection is conservative, as the technical target could be much higher. |
🔻 Bearish (Less Likely) | Break below the key support line (€6 - €8) | €4 - €6 | A bearish breakout, although less likely given the project's utility, would indicate a failure of the bullish consolidation trend, leading to a re-test of the cycle lows. |
💡 Key Conclusion
Chainlink (LINK) is in a crucial phase of long-term consolidation. The Symmetrical Triangle acts like a price spring. The zone of €11.61 (current price on the chart) is at the midpoint of the pattern. A confirmation of the bullish breakout from the triangle, ideally surpassing previous resistance levels before the all-time high, would set the stage for an extremely bullish 2026 for the asset.