📈 AVAX Chart Pattern Analysis
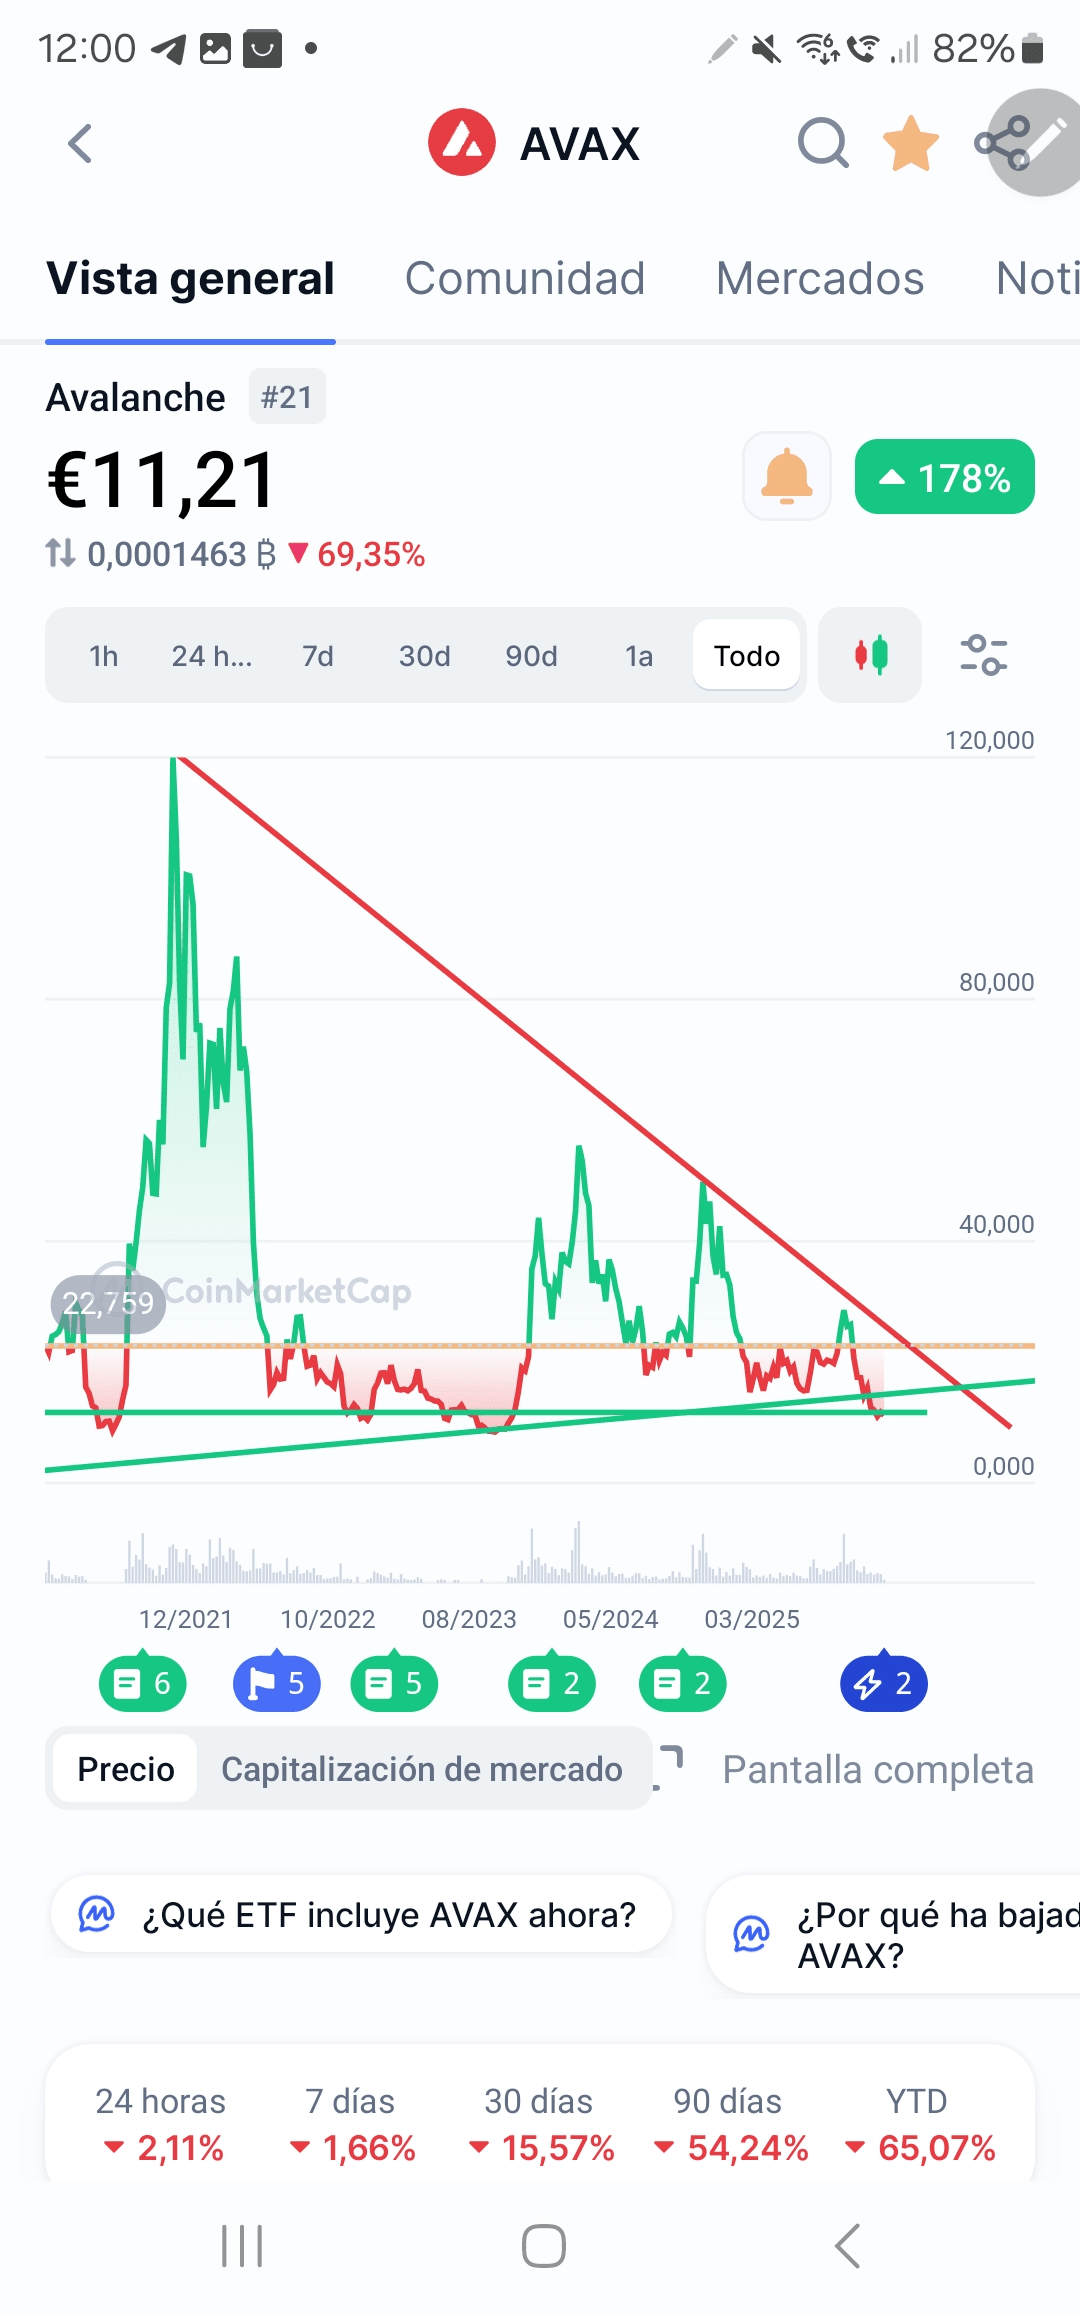
The chart you show covers a time period that spans approximately from late 2021 to early 2025 (according to the X-axis labels).
* Dominant Pattern: The red line drawn over the relative highs (peaks) clearly indicates a long-term downtrend or descending resistance line.
* This pattern shows that, despite the bounces and intermediate bullish periods, the maximum price of AVAX in each cycle has consistently been lower than the previous one.
* Accumulation/Support Zone: There is a horizontal zone around the relative lows (approximately in the area marked with the dotted horizontal green line in the image). This zone seems to have acted as support or an area where buying interest has been significant historically.
* Possible Descending Triangle (or Descending Wedge): The confluence of the descending trend line (red) and the horizontal support zone (green) forms a figure that resembles a Descending Triangle or a Descending Wedge (depending on the exact slope of the support line, which in the chart appears almost flat).
* Implication: A Descending Triangle is typically considered a bearish continuation pattern, but in a long-term accumulation context at a strong support, its eventual breakout to the upside may indicate the end of the bearish trend and the beginning of a new bullish cycle.
* Current Point: The price is trading very close to the intersection of this descending trend line and the historical support zone, suggesting that an important decision moment for the price is approaching, where a breakout could be very explosive.
📅 Projection for 2026
The projection for 2026 is based on the expectation that the cryptocurrency market, in general, may be in a macroeconomic recovery phase and a possible bullish cycle, as well as the growth potential of Avalanche.
Analysts' and institutions' forecasts vary significantly, reflecting the high uncertainty of the market:
🟢Optimistic (Strong Bullish Cycle) | $70 - $120+ USD | Expansion of the Avalanche ecosystem, institutional adoption, and a successful breakout of long-term resistance, driven by an overall bullish market. |
🔵Moderate (Sustained Growth) | $40 - $70 USD | Steady network growth, overcoming key resistances, but with moderation in the overall market momentum. |
🟠Conservative (Slow Recovery or Consolidation) | $14 - $40 USD | The price struggles to break the long-term resistance, or temporarily falls to support, but consolidates for a subsequent rise. Some user projections on platforms like Binance place it around $14.11 - $13.95 (this could be a more cautious view or based on a lower growth rate).
🔑 Key of the Chart: The confirmation of an optimistic projection will depend on the clean and volume-driven breakout of the long-term descending trend line (the red line) and the conversion of previous resistance levels (for example, $26, $40) into new supports.