📉 Technical Analysis of the PYTH Chart (Interval: 1 month)
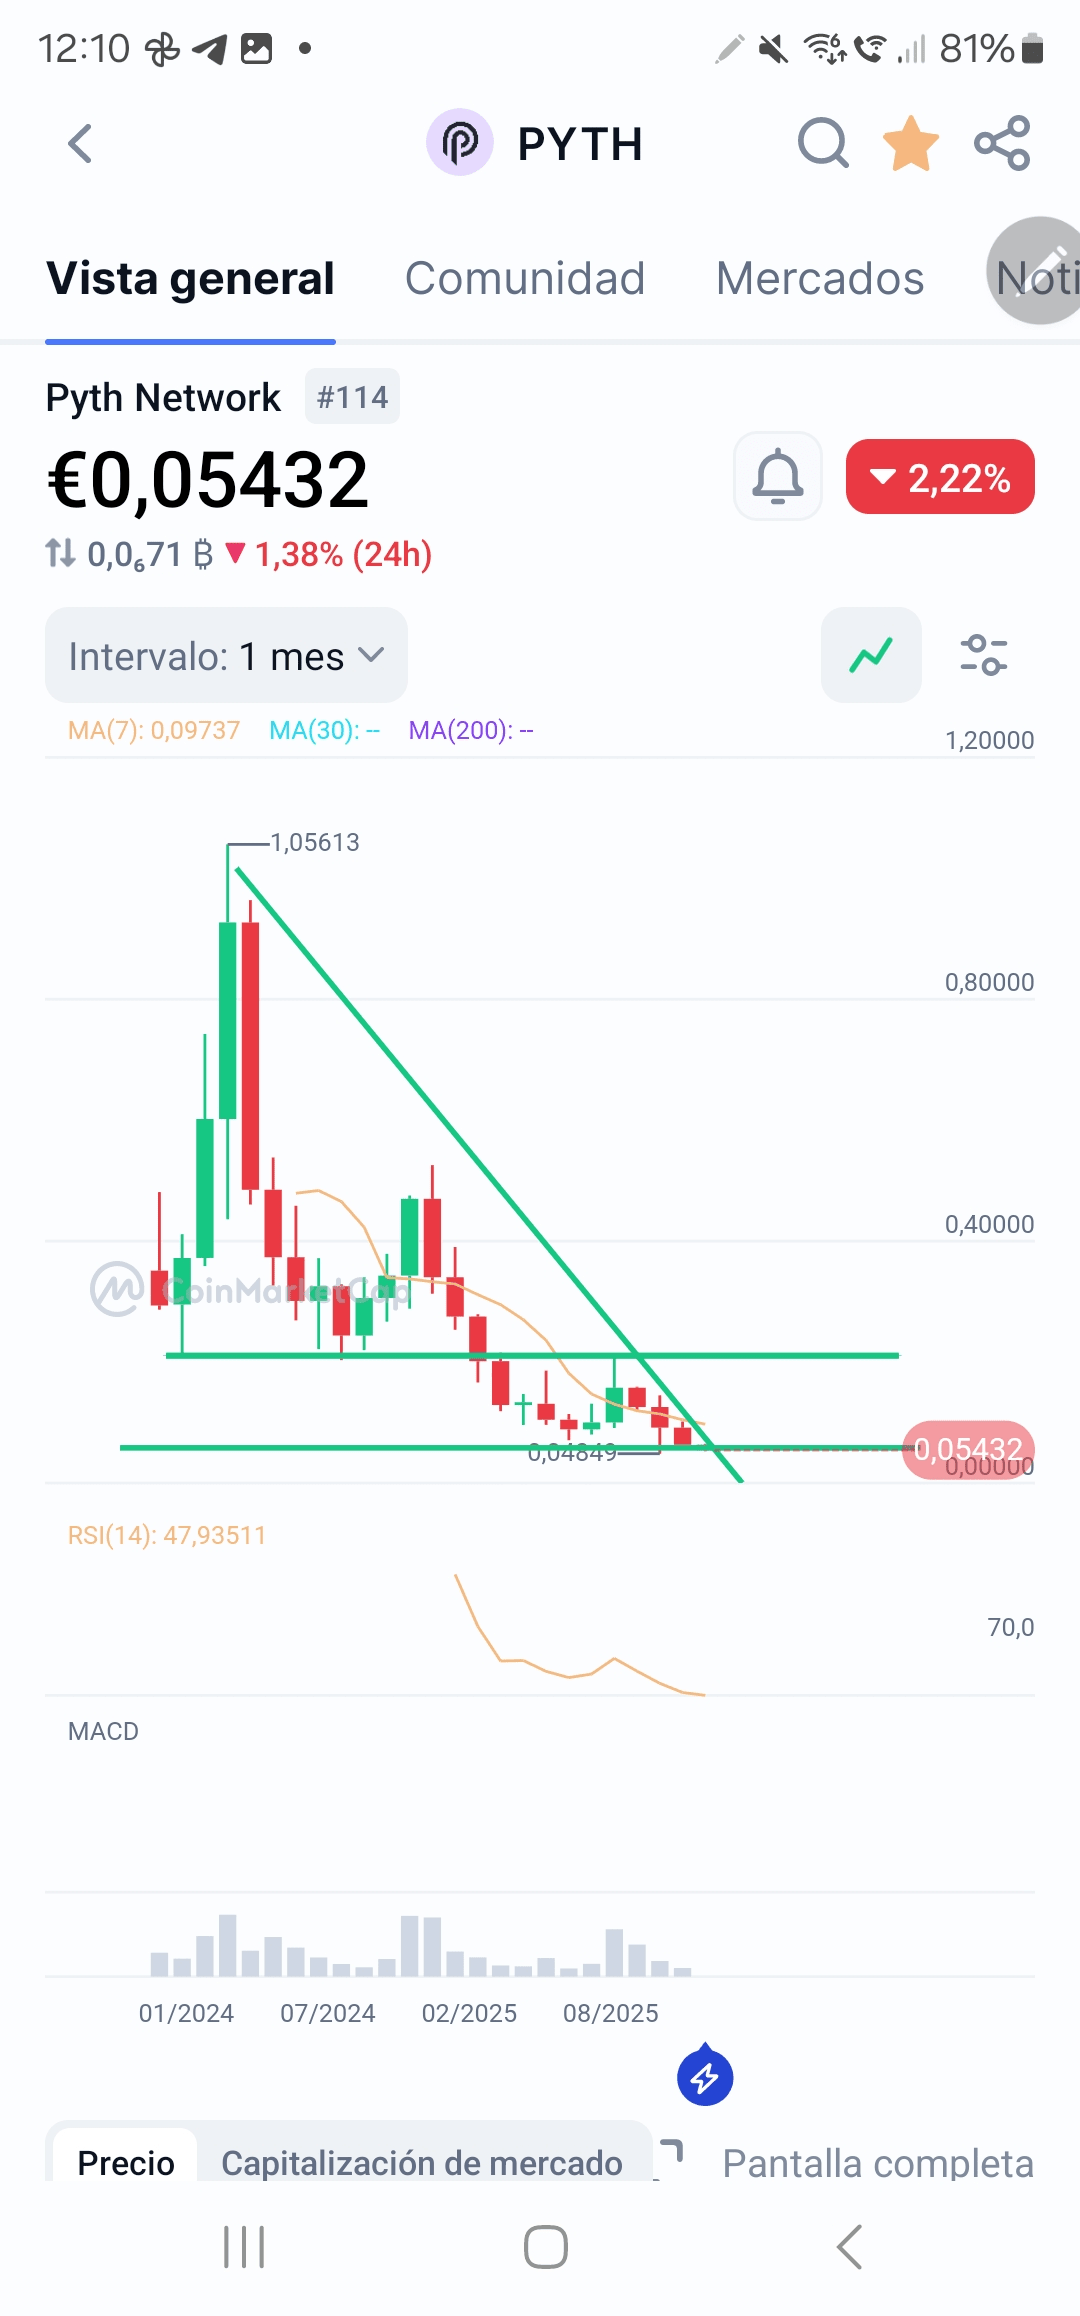
The chart shows the price action of PYTH over a period of approximately one year (March 2024 to December 2025) with monthly candles.
1. Identified Pattern (Descending Triangle)
* General Trend: Clearly bearish since the all-time high (ATH) of $1.05613 reached in the first candle (March 2024).
* Pattern: The price appears to be forming a Descending Triangle (marked with the green trend line).
* Upper Trend Line (Resistance): A trend line connecting lower highs ($1.05613, then lower highs). This indicates constant selling pressure.
* Lower Trend Line (Support): A horizontal or nearly horizontal support zone, near the $0.05- $0.06 area (where the price is currently consolidating and bouncing several times, as indicated in the highlighted red/green area).
* Implication: A descending triangle is generally a bearish continuation pattern. A breakout below the horizontal support would confirm the downward trend. However, at this point, the congestion near the support could be interpreted as a phase of accumulation or consolidation before a possible rebound or final breakout.
2. Key Indicators
* RSI(14) - Relative Strength Index: Currently at 47.93511.
* This value (close to 50) suggests a neutral position on the monthly timeframe. There is no extreme overbought or oversold condition, validating the current phase of consolidation.
* Moving Averages (MA):
* The MA(7) is at 0.09737, and the MA(30) and MA(200) do not have visible values.
* The orange line accompanying the price (probably a short-term MA) is above the current price, confirming short-term bearish pressure, but the price is approaching it.
3. Conclusion of Pattern Analysis
The price of PYTH is in a critical consolidation phase near its historical low.
* Bullish Scenario: If the price manages to break and close above the descending trendline (resistance) and the MA(7) at $0.09737, the triangle pattern would be invalidated, opening the door to a rise.
* Bearish Scenario: A breakout and close below the support in the $0.05-$0.06 zone could lead to new historical lows.
🚀 Projection for PYTH in 2026
The price projection for any cryptocurrency in 2026 is subject to high speculation and depends on multiple technical and fundamental factors (such as the general bullish/bearish market, project adoption, and token unlocks).
PYTH Fundamentals
* Pyth Network is a key decentralized financial oracle that provides real-time price data from first-hand institutions to multiple blockchains. Its utility is essential in the DeFi ecosystem.
Source-Based Projections
Price predictions vary widely, highlighting market uncertainty:
Could look for highs between $0.2 and $0.5, or even more if there is a general bullish cycle. | |
Factors to Consider for 2026
* Token Unlocking: PYTH has a large circulating supply and a token unlocking schedule until 2027. Massive token unlocks often increase selling pressure in the market.
* Adoption of Oracles: Its growth in adoption by more DeFi protocols and its success in competing with other oracles like Chainlink will be crucial.
* Crypto Market Cycle: If the general market enters a bullish phase, even a crypto with unlocking pressure like PYTH could rise significantly.
In summary:
🟠 Conservative Range (Bearish Continuation): If the current pattern breaks downward, the price could remain in the range of $0.05 to $0.10.
🟢Optimistic Range (Rebound/Bullish Cycle): If the resistance of the descending triangle is broken, and with possible aid from a broader bullish market, PYTH could retest levels of $0.20 to $0.50 or even higher.