#FHEusdt #BTCUSDT #SOLUSDT $FHE


# Analysis of the FHE/USDT pair
Time range: 2025-12-14 20:45:00 ~ 2025-12-15 07:45:00
Nature of the data: Real-time data
## Analysis of Candlestick Patterns
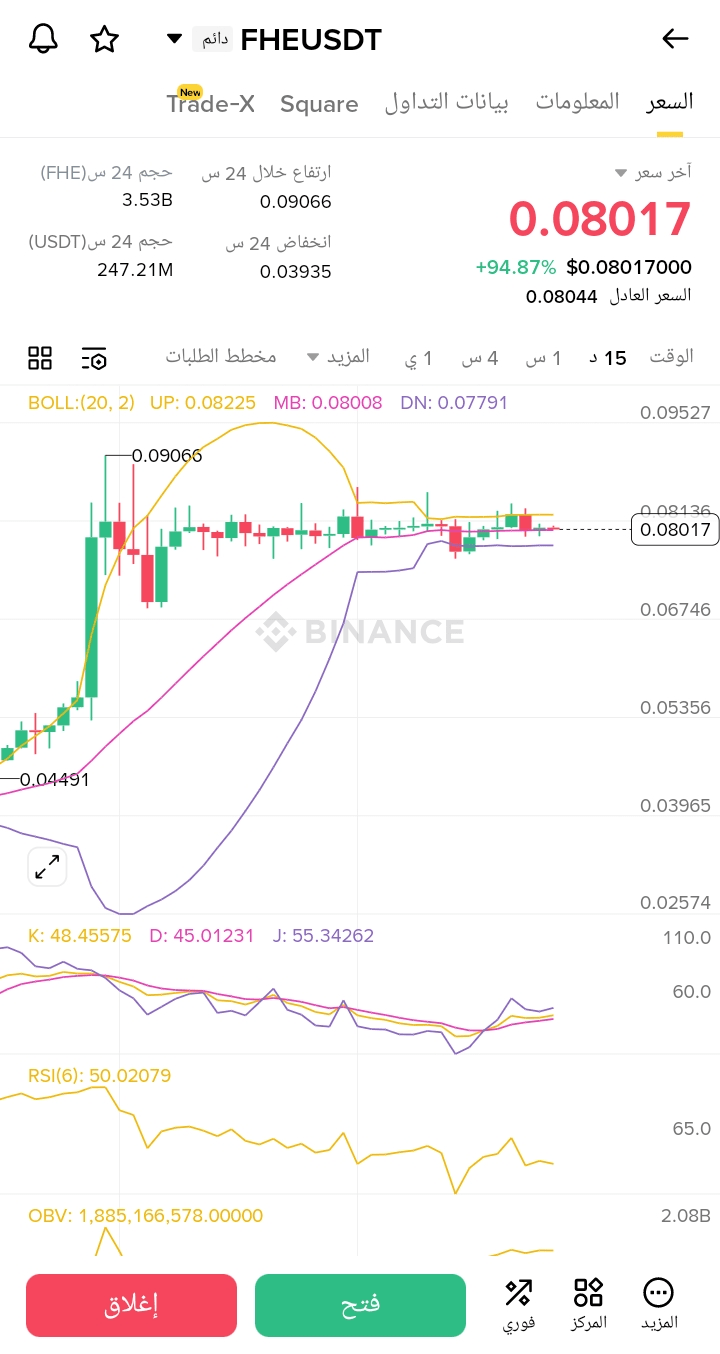
*Sharp rise at the beginning of the chart** - where the price rose from 0.04140 to about 0.08918 - strong bullish signal
*Doji pattern around the price 0.08200 after a sharp rise** - indicates market indecision and potential trend reversal - medium strength signal
*Long bearish candle at 0.07500** - correction after strong rise - medium bearish signal
*Hammer pattern at approximately 0.06800** - indicates the end of selling pressure and the beginning of support - strong bullish signal
*Sideways consolidation pattern (flag pattern) between 0.08000 and 0.08200** in the latter half of the chart - indicates price stability after volatility - neutral signal
## Technical Indicators Analysis
*Trading Volume (VOL)**: Significant increase in trading volume during the initial rise, followed by a gradual decrease as the price stabilizes, confirming the strength of the initial bullish trend
*Other Indicators**: No other technical indicators are clearly visible in the provided chart for analysis
## Identifying Support and Resistance Levels
*Main Resistance**: 0.08900 (highest price recorded)
*Medium Resistance**: 0.08300 (recurrent bounce area)
*Near Support**: 0.08000 (level tested multiple times)
*Medium Support**: 0.07500 (previous bounce area)
*Strong Support**: 0.06800 (bounce level after correction)
## Overall Technical Assessment
The FHE/USDT pair shows a sharp initial rise of over 100%, followed by correction and consolidation. The volume movement aligns with price movement, where volume was high during the strong rise and then gradually decreased as the price stabilized. The overall trend is bullish in the short term, with a sideways consolidation pattern forming that could lead to a continuation of the bullish trend.
## Summary
The FHE/USDT pair shows clear bullish strength with a rise of 95.51% during the analyzed period. After the sharp rise, the price entered a sideways consolidation phase around 0.08000, indicating relative stability.
For traders, considerations include:
1. Buy at support levels 0.08000 and 0.07500 with a stop loss below 0.07000
2. Take profits near resistance levels 0.08300 and 0.08900
3. Monitor trading volume to ensure the strength of the trend continues