
# Analysis of the trading pair BAS-USDT
Time period: 2025-12-14 20:45:00 ~ 2025-12-15 07:45:00
Nature of data: Real-time data
## Analysis of Japanese candlestick patterns
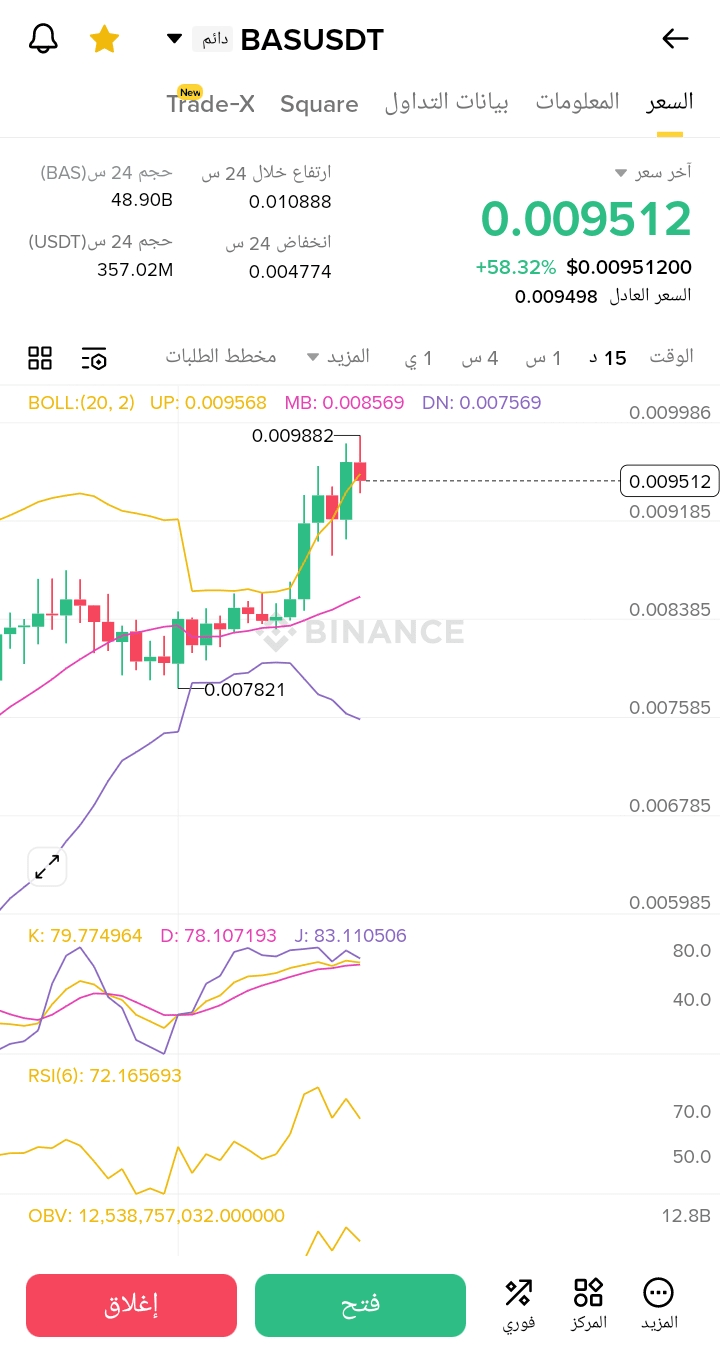
*A strong long green candle appears at the beginning of the chart around 0.006306** - A strong bullish signal indicating buyers are entering aggressively
*A sharp rise pattern forms around the price 0.010906** - A new peak appears with high trading volume - A strong bullish signal
* A downward correction pattern formed after the peak** - Temporarily exhausting bullish momentum - Medium signal
* A horizontal accumulation pattern between 0.008000 and 0.009000** - Base formation period before the breakout - Medium bullish signal
* A series of consecutive green candles appearing in the second half of the chart** - Resumption of the bullish trend - Strong bullish signal
* The last candle shows an upper shadow at 0.009621** - Potential resistance and profit-taking - Weak warning signal
## Analysis of support and resistance levels
Resistance levels:
* Major resistance: 0.011000 (previous peak)
* Medium resistance: 0.010000 (psychological level)
* Nearby resistance: 0.009700 (the highest level recorded recently)
Support levels:
* Nearby support: 0.009000 (previous accumulation area)
* Medium support: 0.008000 (previous accumulation area)
* Strong support: 0.006300 (beginning of the bullish movement)
## Overall technical assessment
* Volume and price coordination**: A significantly high trading volume appeared during the initial rise, confirming the strength of the bullish movement. Volume decreased during the consolidation period, then rose again with the resumption of the bullish trend.
* General market trend**: The overall trend is strongly bullish, with a rise of 62.23% during the analyzed period. The pair managed to form a new peak and started a new upward wave.
* Summary of technical signals**: Bullish signals clearly dominate, with positive candle patterns and confirmations from trading volume.
## Conclusion
The BAS-USDT pair shows a strong bullish trend with a significant increase in price and volume. Traders can take advantage of this positive momentum by placing profit-taking orders near the specified resistance levels (0.010000 and 0.011000).
Operational suggestions:
* Buying may be considered at rebounds near support levels 0.009000 and 0.008000.
* Place profit-taking orders near resistance levels 0.010000 and 0.011000.
* Set the stop-loss below the 0.008000 level for short-term trades.
Risk warnings:
* The rapid rise of 62.23% may lead to a short-term correction.
* Trading volume should be monitored to ensure the continuation of bullish momentum.