#solana #SOLUSDT #SOLUSDT! $SOL

# Analysis of the trading pair SOL-USDT
Time period: 2025-12-14 21:00:00 ~ 2025-12-15 08:00:00
Data Nature: Real-time data
## Japanese Candlestick Pattern Analysis
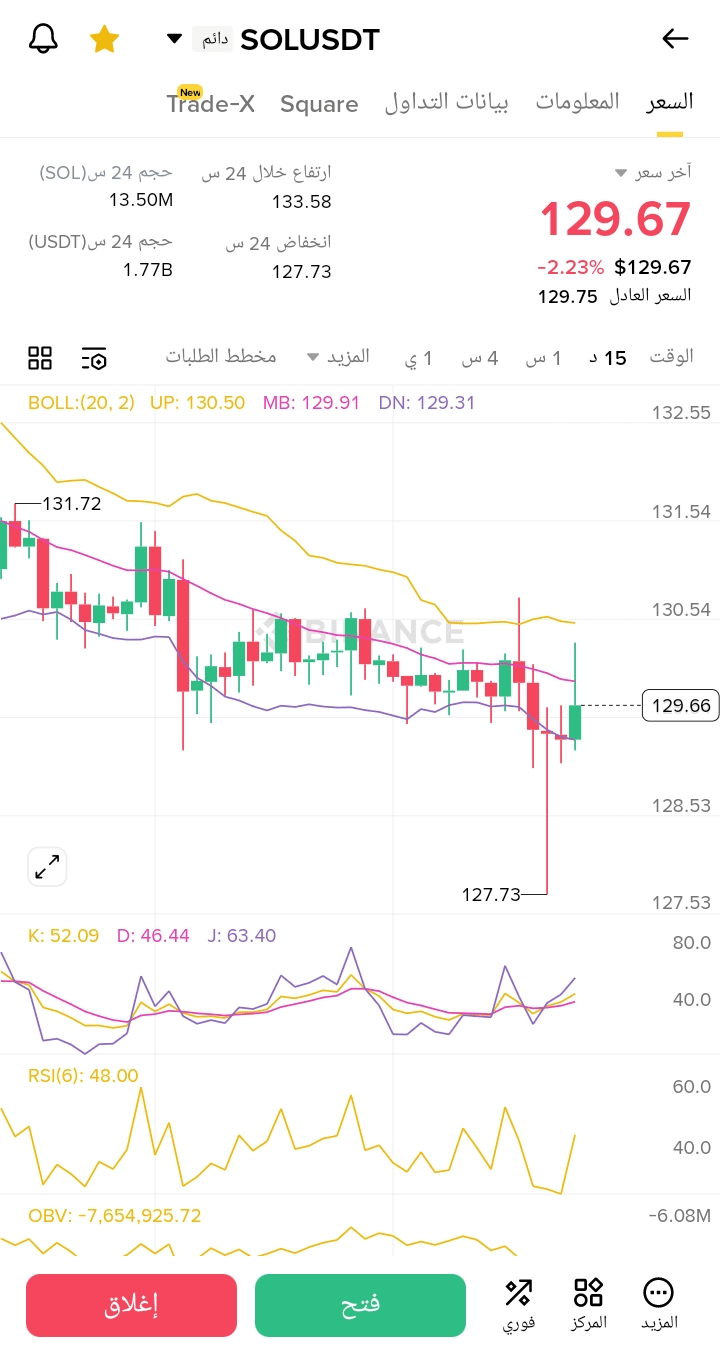
*Appearance of a consecutive bearish pattern at the start of the chart at level 131.710** - Indicates weakness of buyers - Strong signal
*Forms a doji pattern around the midpoint of the chart at level 130.256** - Indicates market frequency and uncertainty - Medium signal
*A long red candle appeared at the end of the chart down to 127.865** - sharp price collapse with high trading volume - strong sell signal
*The last candle is a small green one at 129.561** - weak bounce attempt after sharp decline - weak buy signal
## Analysis of support and resistance levels
Resistance levels:
* Strong resistance: 131.700 (previous peak area)
* Medium resistance: 130.250 (previous fluctuation area)
* Near resistance: 129.500 (psychological level)
Support levels:
* Near support: 128.400 (last bounce area)
* Medium support: 127.900 (near the lowest recorded price)
* Strong support: 127.000 (important psychological level)
## Overall technical assessment
*Volume and price coordination**: a significant increase in trading volume appeared with the long red candle, confirming the strength of selling pressure
*General trend direction**: bearish in the short term with a decrease of 2.34% in the last update
*Summary of technical signals**:
- Bearish signals: consecutive downward pattern, long red candle with high trading volume
- Bullish signals: recent green bounce attempt
## Summary
The SOL-USDT pair is experiencing clear selling pressure with a sharp decline in price from 131.710 to 127.865. The significant increase in trading volume with this drop indicates the strength of the sellers. The recent weak bounce may be an attempt to form a temporary bottom, but it needs confirmation with higher trading volume.
Operational suggestions:
* For short-term traders: wait for confirmation of the bounce before entering buy trades
* For medium-term traders: monitor support level 127.900, if broken, the decline may continue towards 126.000
Risk warnings:
* Continued selling pressure may lead to a breach of current support levels
* High market volatility requires strict risk management and setting appropriate stop-loss points
* High leverage should not be used under these volatile conditions