How do I approach charts
(And where to start with technical analysis)
Technical analysis is one of the most misunderstood tools in trading.
Some people consider it astrology. Others think it’s useless noise. Most beginners are somewhere in between, confident that they just lack knowledge about the right indicator or the perfect pattern.
I thought that way too, a long time ago.
What changed my trading was not learning more technical analysis, but changing my mindset about charts.
This article is not a cheat sheet, not a strategy, and not a pattern guide. It is a mental framework that I use when opening a chart and deciding whether to risk money or do nothing.
Why I didn't improve my skills first
When I started, I approached TA the same way most people do:
- accumulating indicators,
- memorizing patterns,
- was looking for confirmation everywhere.
Every chart felt like a question that needed the right answer. Every loss felt like proof that I lacked knowledge.
Looking back, I realize: the problem was not in execution — but in intention.
I kept asking the charts where the price would go.
Markets don't work that way.
Transition: TA is about risk, not prediction
The most important change I made:
I stopped asking where the price would go,
and started asking where I could be wrong.
Technical analysis became useful once it started helping me:
- identifying invalidation points,
- structuring risk,
- avoiding bad zones.
TA does not exist to make you right.
It exists to keep you from being reckless.
Once you accept this, everything simplifies.
Charts are behavior maps, not signal machines
Price charts are records of human decisions.
Fear, greed, swings, regrets — all of this is visible in the structure and levels. That's why TA works on stocks, cryptocurrencies, forex, commodities. The tool doesn't matter. Human behavior does.
Support and resistance levels are not magic lines.
These are memory zones, areas where traders previously experienced pain or reward.
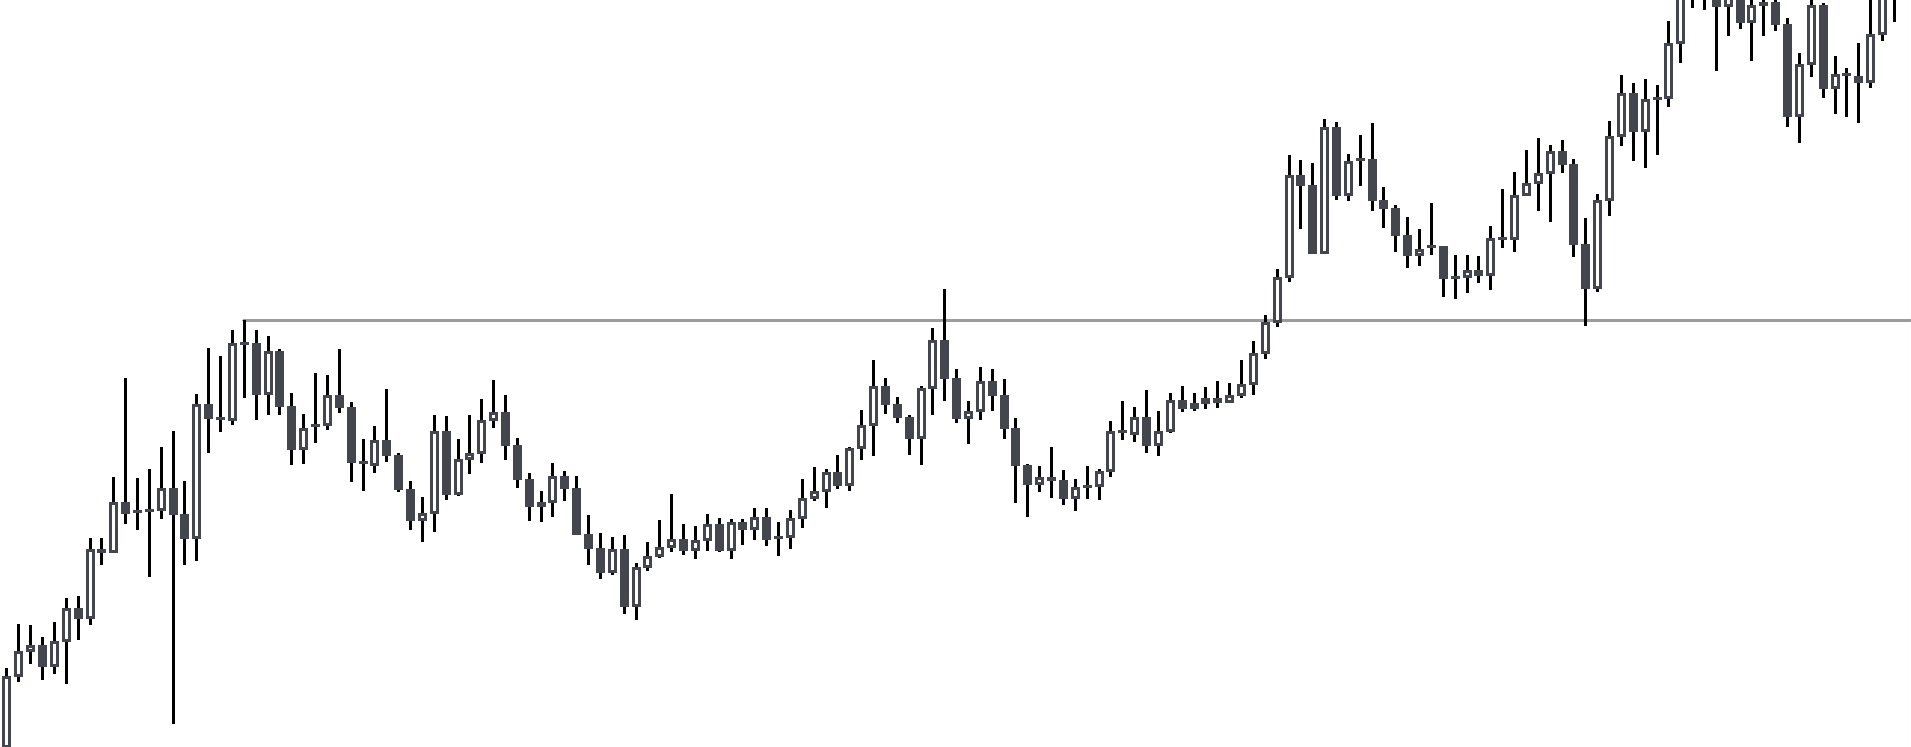
▫️Example chart: previous high → breakout → retest
If you understand why a level is important, you don't need ten indicators to justify it.
Start with larger timeframes, zoom in later
Most people do this the other way around. They open a 5-minute chart, see a pattern, and jump into a trade.
And then they get stopped out because there was a strong resistance level on the daily chart that they didn't check.
Always start with higher timeframes:
- Daily chart = overall structure and context
- 4-hour chart = where the real levels are
- Lower timeframes = only for timing entries
The lower the timeframe, the more noise. A beautiful setup on a 15-minute chart means nothing if you're longing into resistance on the daily.
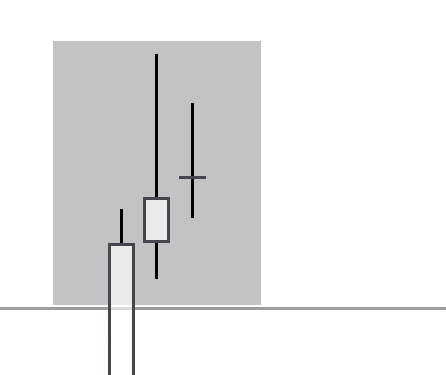
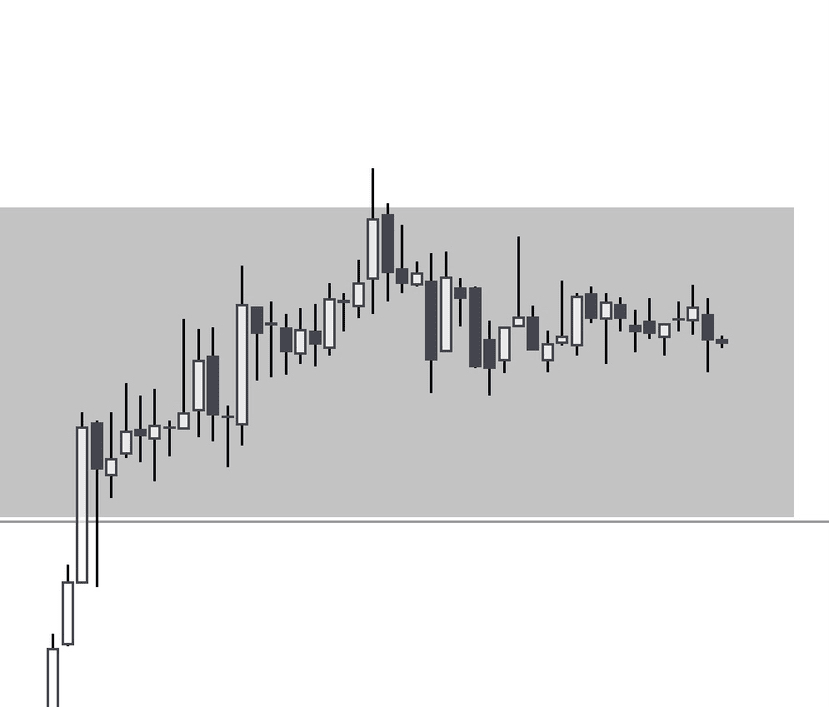
▫️Example chart: HTF level vs LTF noise
Structure before patterns (always)
Before I was interested in patterns, indicators, or setups, I wanted to understand market structure.
Structure answers the questions:
- Is it a trend or a sideways range?
- Are we forming higher highs or lower lows?
- Is momentum building or is it
First context. Then patterns.
Once you see this, you will stop forcing trades in conditions designed to slowly bleed you dry.
Patterns: why they sometimes work (and often fail)
Patterns don't fail because they are fake.
They fail because context is ignored.
The same pattern:
- at the high timeframe level,
- after a prolonged move,
- into the liquidity zone,
— not the same pattern as somewhere in the middle of nowhere.
Wolfe waves, flags, head and shoulders — these are context tools, not trading signals.
How I decide to take a trade
I don't follow strict rules. I follow the process of reasoning.
Before entering a trade, I want clear answers to:
- What is the narrative on the higher timeframe?
- At what level am I trading?
- Where is the invalidation?
- Where is liquidity likely located?
- Is the risk asymmetric?
If I can't quickly answer these questions, I don't trade.
One thing I learned the hard way:
Urgency is usually a warning sign.
If a trade feels rushed, emotional, or 'too good to miss', it usually is.
Indicators: why less gave me more
I tested most indicators at some point.
Indicators alone do not create an advantage.
They help with execution, not with decision-making.
Today I keep everything simple:
- Volume for context
- EMA 10,20,200
The cleaner the chart, the clearer the thinking.
How to learn TA without drowning in it
The biggest danger when learning TA is not a lack of information.
That's too much information.
Good learning focuses on:
- structure,
- risk management,
- reviewing and journaling.
Bad learning focuses on:
- win percentages,
- signal accuracy,
- endless variations of indicators.
Books are important. Fundamentals are important.
But nothing accelerates learning like a tight feedback loop:
Plan → Execute → Take a screenshot → Analyze → Repeat
Most traders don't need the best strategies.
They need better thinking.
Avoid everything that promises:
- guaranteed profit,
- secret indicators,
- effortless automation.
If I had to start over today
I would intentionally limit myself:
- one asset,
- one HTF,
- one execution timeframe,
- one type of setup.
I would mark levels every day.
I would take screenshots of every trade.
I would review more than I traded.
Boring repetition always beats exciting complexity.
The real advantage: doing nothing
Most of the time, you should be spending not trading.
Observing. Waiting. Marking levels. Analyzing what worked and what didn't.
The advantage is not in finding more setups. It is in avoiding bad ones.
Trade when you have a real advantage, not when you're bored.
Final thoughts
Technical analysis didn't make me rich.
It made me calmer.
More patient.
Being more aware of when not to trade.
TA is not about predicting the future.
It's about structuring risk so that when you are wrong — and you will be — the damage is controlled.
Everything else will come later.