
The price of Litecoin continues to decline for the seventh consecutive day on Tuesday after failing to break through a key resistance area.
The social dominance of LTC has been steadily declining since early December, indicating fading market interest and weak sentiment.
Traders should exercise caution, as momentum indicators suggest bearishness alongside negative funding rates.
Litecoin ($LTC ) remains under significant selling pressure, trading below $78 on Tuesday, extending its losing streak to seven consecutive days after being rejected at a key resistance area. With fading social interest and momentum indicators turning bearish, downside risks remain prevalent.
Fading social interest affects Litecoin's price
The social dominance gauge from Santiment for Litecoin supports bearish expectations. The indicator measures the share of discussions related to $LTC across cryptocurrency media. It has consistently declined since early December, reaching an annual low of 0.032% on Tuesday. This decline indicates fading market interest and weak sentiment among LTC investors.
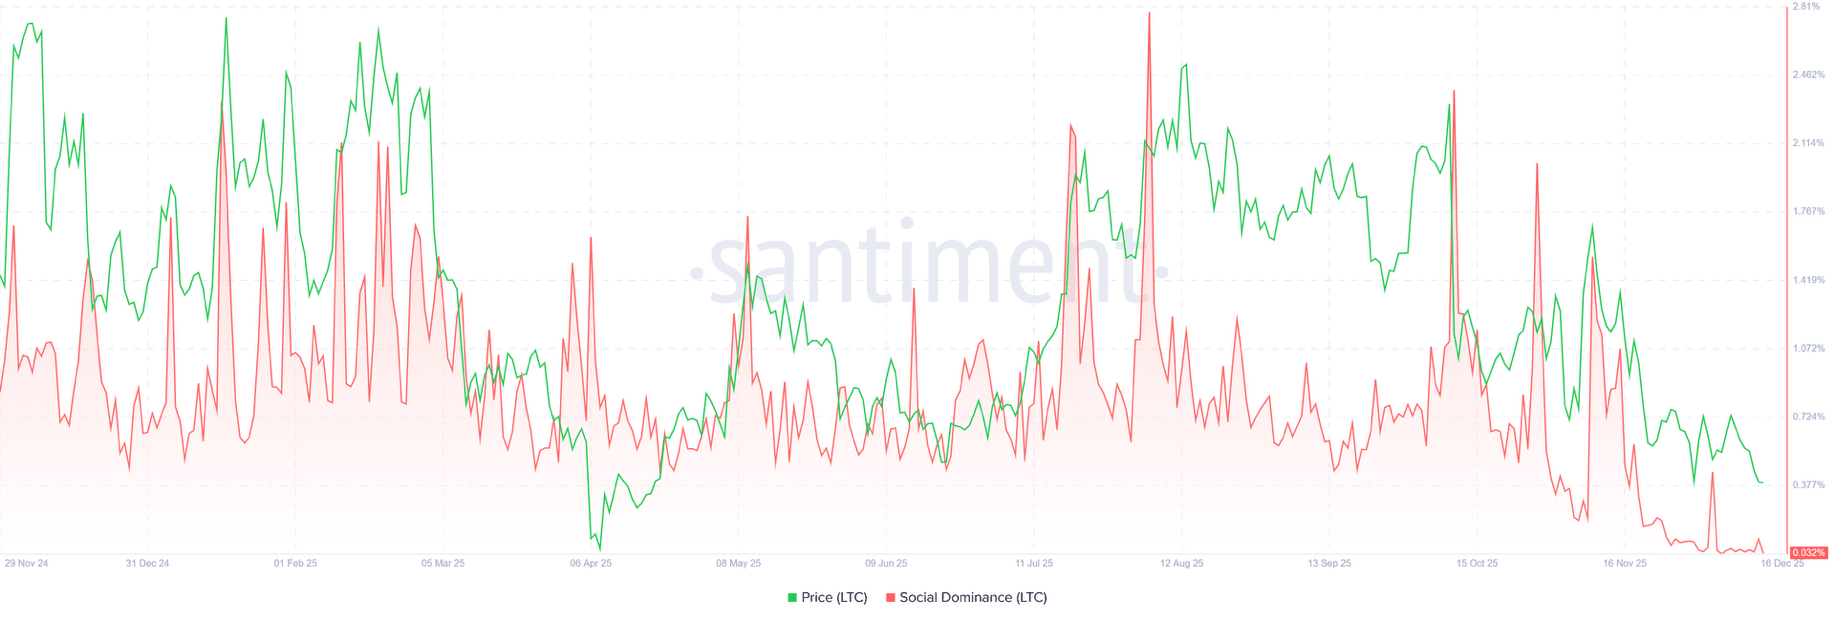
Chart of LTC social dominance. Source: Santiment
On the derivatives front, the data also supports bearish expectations for Litecoin. Weighted funding rate data from Coinglass shows that the number of traders betting on a decline in LTC price exceeds those expecting an increase.
The gauge turned to a negative rate on Tuesday, now at -0.002%, indicating that short positions are paying for long positions. Historically, when funding rates turn negative, LTC prices drop sharply.
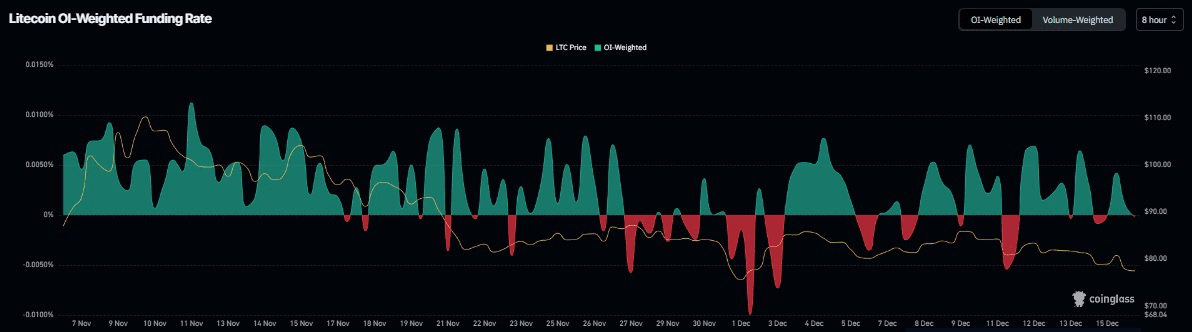
Chart of Litecoin funding rate. Source: Coinglass
Litecoin Price Forecast: Bears in control of momentum
Litecoin's price was rejected around the Fibonacci retracement level of 38.20% at $84.63 on December 10 and corrected by nearly 9% with six consecutive red daily candles until Monday, with a retest of weekly support at $77.19. As of writing this report on Tuesday, LTC hovers around $77.51.
If LTC continues to correct and closes below the weekly support at $77.19 on a daily basis, it may extend the decline to the next support at $66.51.
The Relative Strength Index (RSI) on the daily chart reads 37, below the neutral level of 50 and pointing downwards, indicating that bearish momentum is increasing. Additionally, the Moving Average Convergence Divergence (MACD) showed a bearish crossover on Monday, further supporting bearish expectations.
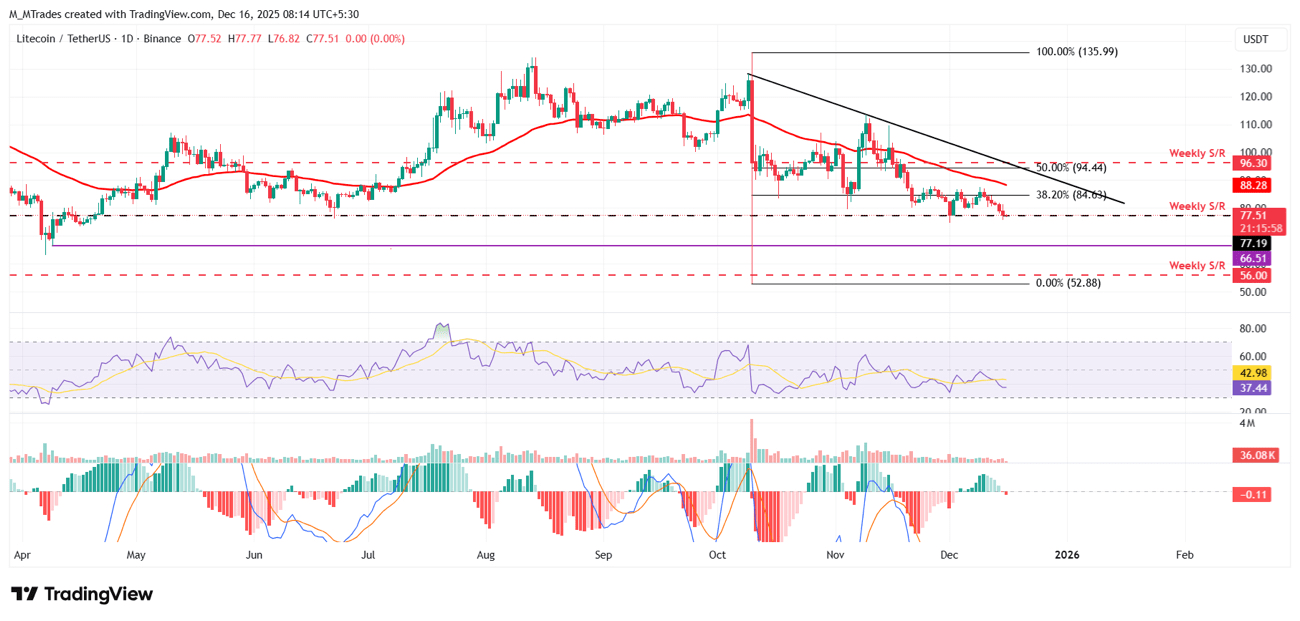
Daily chart of LTC/USDT
On the other hand, if the weekly support holds at $77.19, it may extend $LTC in the recovery towards a Fibonacci retracement level of 38.20% at $84.63.
#LTC #LTC.24小时交易策略 #BinanceSquareTalks #BinanceSquare #BinanceSquareFamily