

XRP bulls are under pressure from sellers as losses increase.
Retail demand for XRP remains significantly low, with an average open interest in futures of $3.71 billion.
Prices failed to respond to encouraging data from ETFs, which saw continuous inflows for 21 days, totaling $1 billion.
Ripple ($XRP ) finds footing above $1.90 at the time of writing on Tuesday after a bearish wave swept through the broader cryptocurrency market, increasing ongoing negative sentiment.
XRP is trading under pressure amid low retail interest.
Retail interest in XRP remains significantly low, with open interest in futures (OI) at $3.71 billion on Tuesday, down from $3.72 billion the previous day. Demand for XRP derivatives has not recovered since the collapse on October 10, which led to the liquidation of $610 million in long positions and $90 million in short positions, according to CoinGlass data.
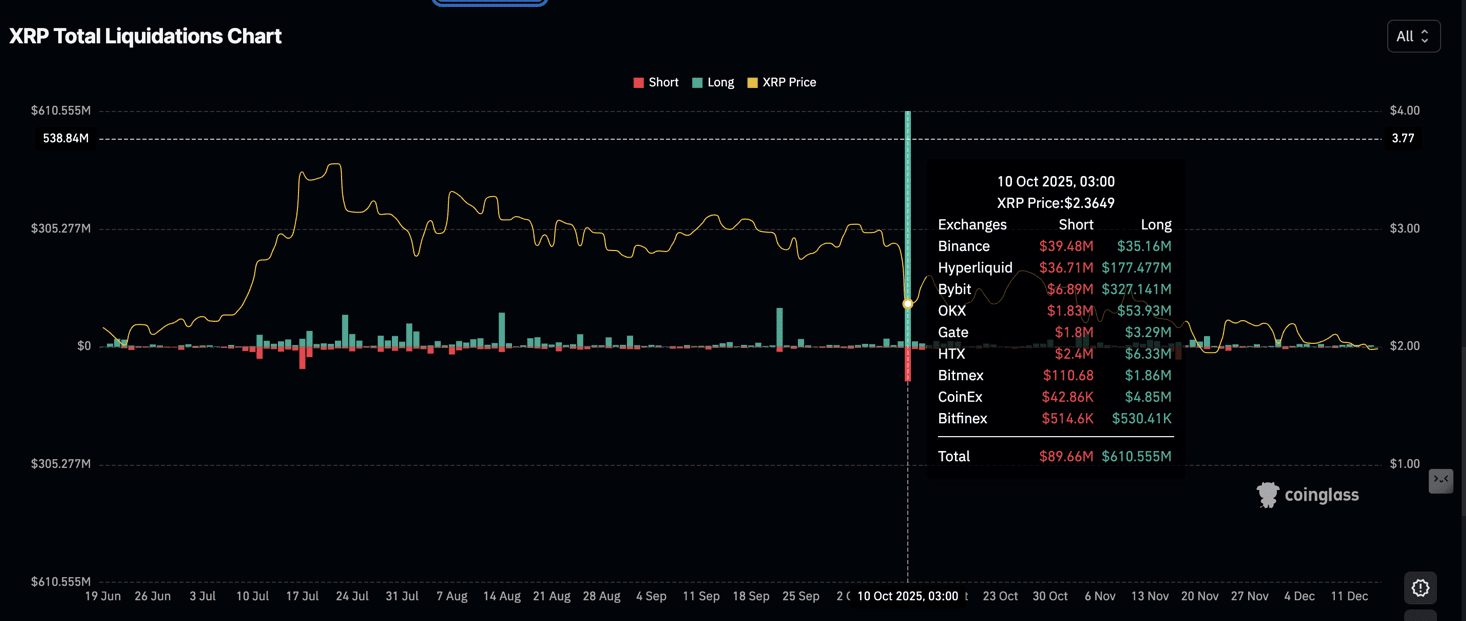
XRP liquidation data | Source: CoinGlass
In comparison, open interest peaked at $10.94 billion on July 22, after recording a new all-time high of $3.66 on July 18. The decline in retail interest reflects weak open interest. This indicates that investors have lost confidence in XRP's ability to sustain upward momentum.
A sustainable recovery in open interest is required to support price advancement beyond the key level of $2.00 in the short term.
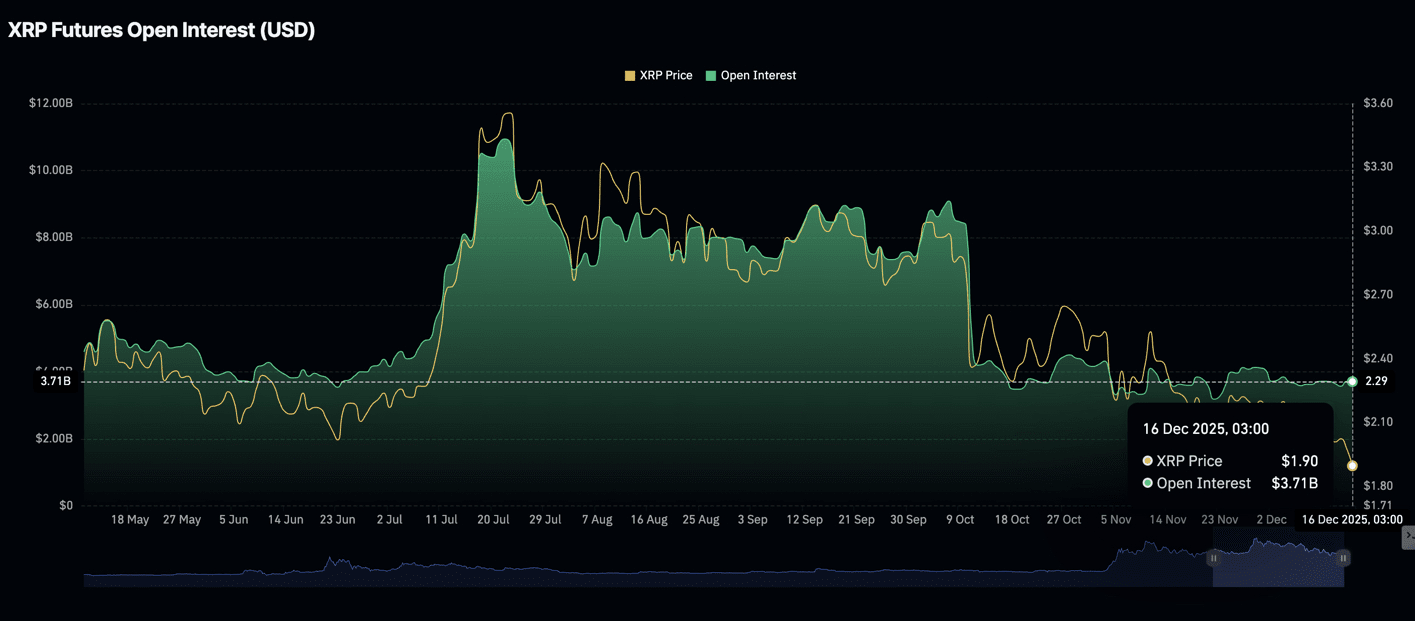
Open interest for XRP | Source: CoinGlass
Despite the decline in retail interest in XRP, listed ETFs in the United States have expanded their inflows for 21 consecutive days, with nearly $11 million deposited on Monday.
The total flow volume reached $1 billion, boosting net assets to $1.12 billion. This ongoing acquisition of XRP ETFs highlights the growing interest in cryptocurrency investment products based on altcoins.
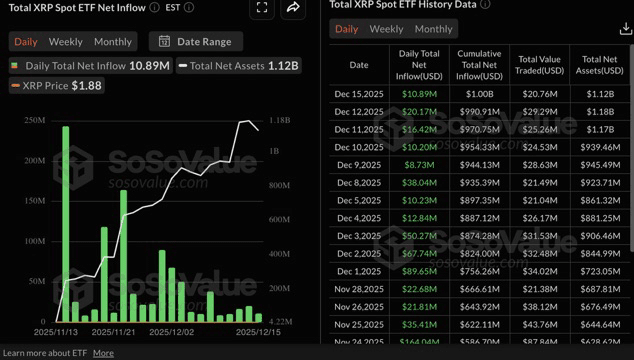
ETF statistics for XRP | Source: SoSoValue
Technical outlook: XRP is trading amid ongoing bearish pressure.
XRP is trading $XRP at $1.91 at the time of writing on Tuesday while remaining below the 50-day exponential moving average at $2.19, the 100-day exponential moving average at $2.37, and the 200-day exponential moving average at $2.44, maintaining a bearish trend.
The Moving Average Convergence Divergence (MACD) is slightly below the zero line on the daily chart, indicating fading momentum. Investors will consider reducing their exposure if the blue line remains below the red signal line. Additionally, the red bars in the histogram are also expanding below the mean line, indicating that bearish momentum is increasing.
The Relative Strength Index (RSI) is at 36.72, below the midpoint and in line with ongoing bearish pressure. The downward trend line at $3.09 limits price advances, with resistance seen near $2.11. However, a close above this hurdle could lead to a corrective bounce above the critical level of $2.00.
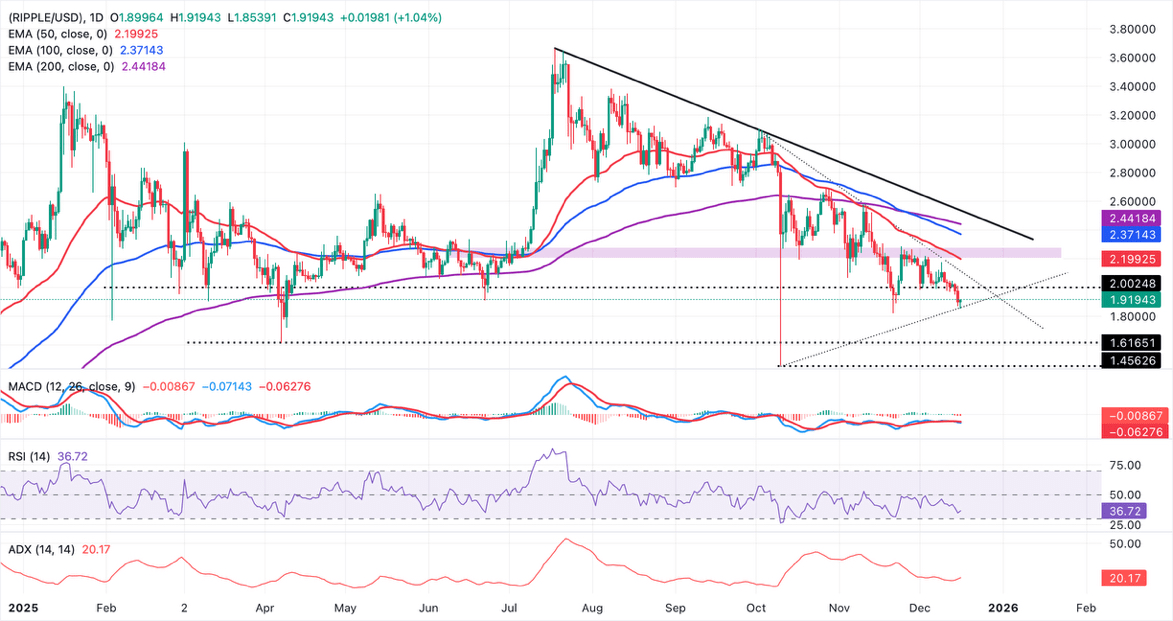
Daily chart for XRP/USD
However, short- and medium-term exponential moving averages continue to slope downward and remain above the spot price, limiting bounces and maintaining an overall bearish bias. At the same time, the ascending trend line from $1.45 supports the broader structure, providing support near $1.86. If XRP breaks below this support level, the price could extend towards the April low of $1.61.