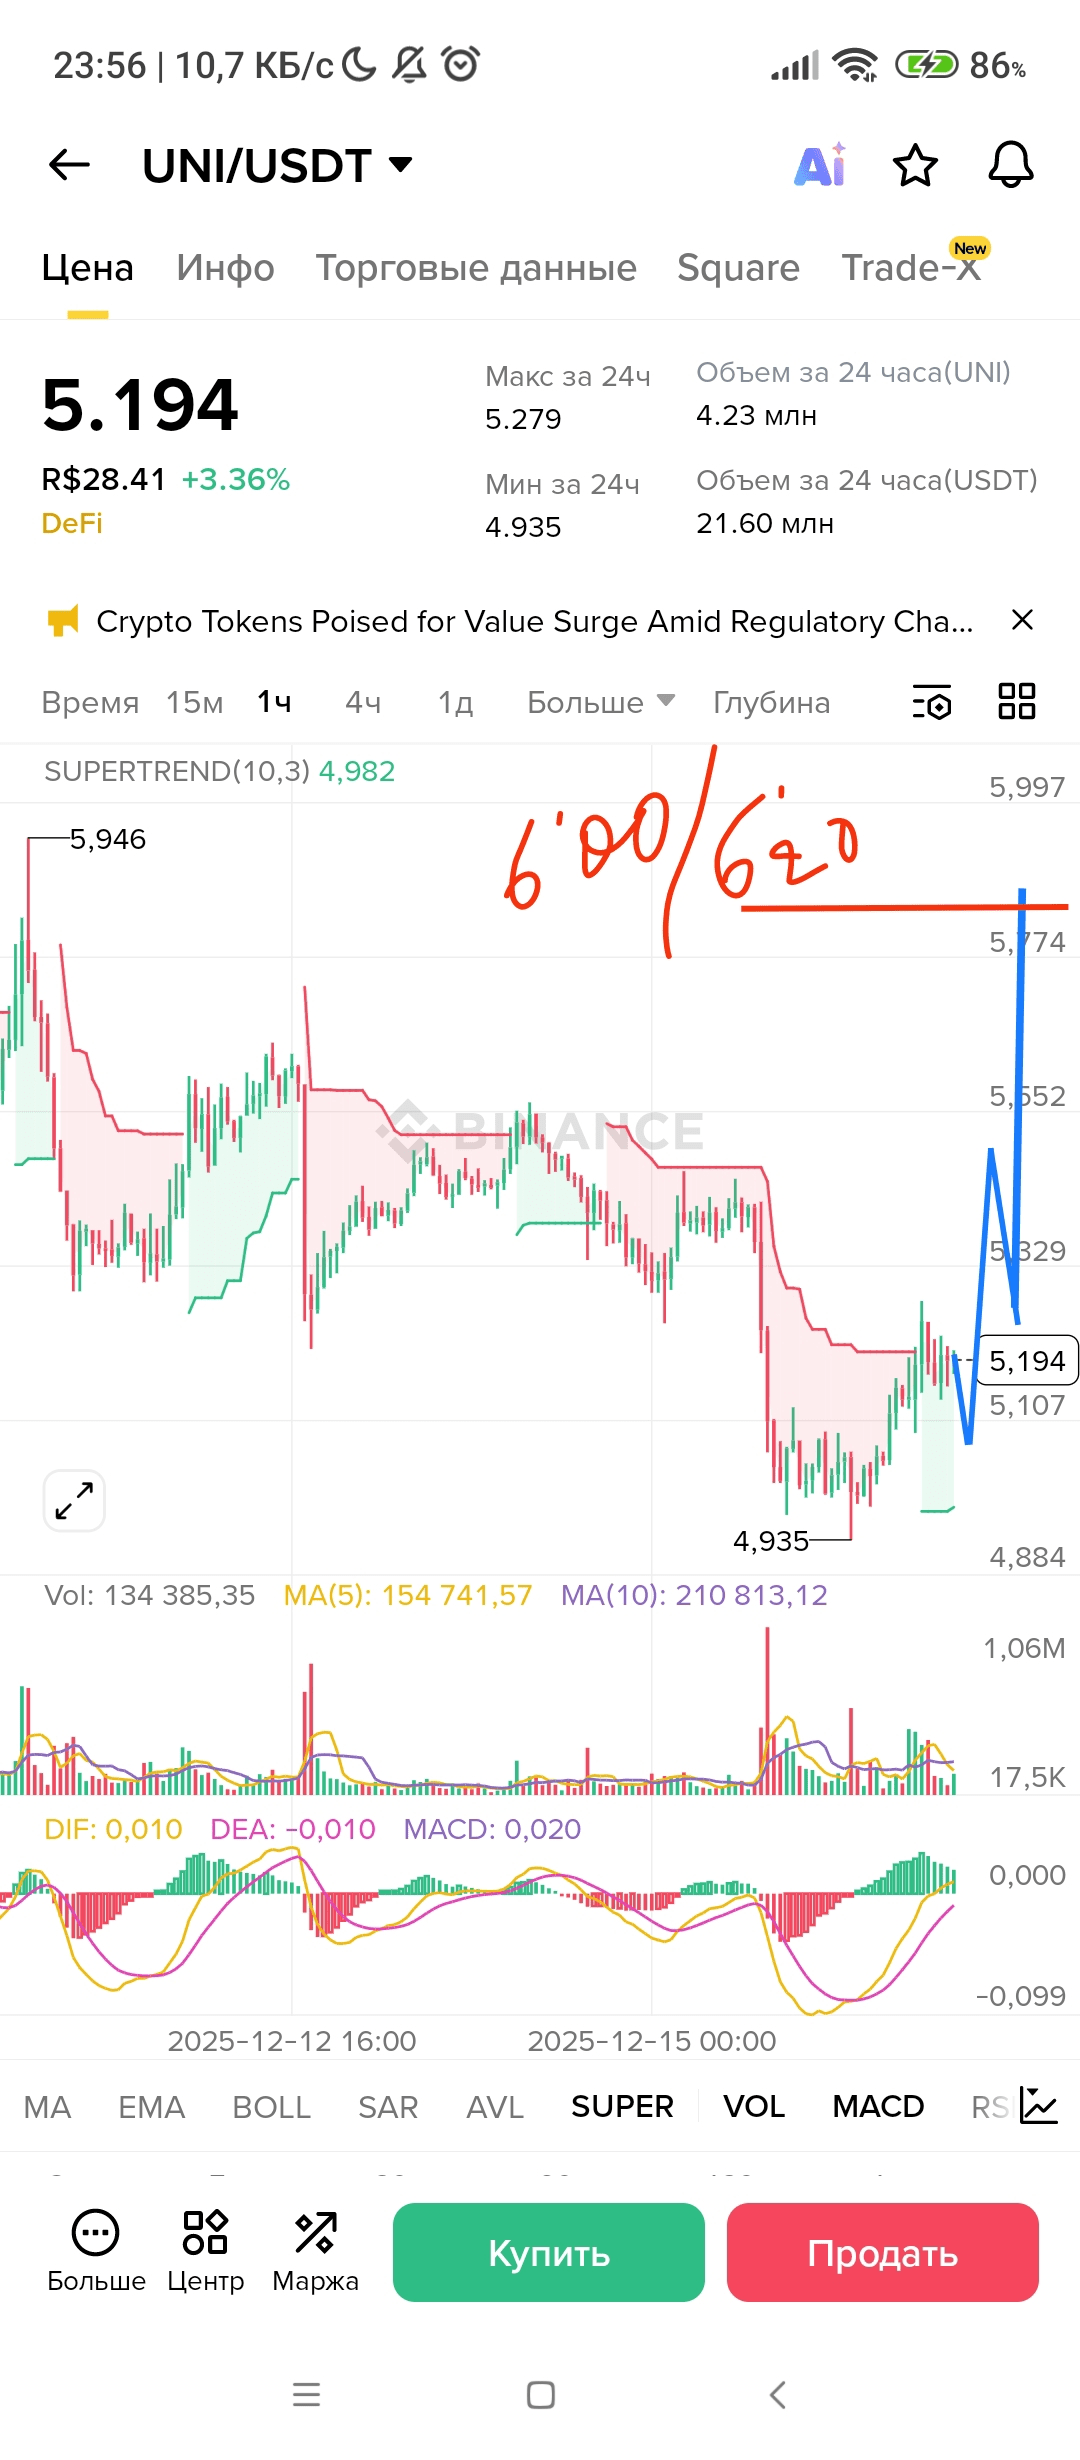
UNI is currently trading in a sideways/bearish range; key levels are support around $5.3–$5.4 and resistance $6.6–$7.3; for a bullish entry, look for a confirmed breakout and close above $5.9–$6.0, for a bearish entry — rejection of resistance or a breakdown below $5.3 confirmed by volume and indicators.
Quick summary plan for entries and targets
| Position | Entry Point | Stop-loss | Target | Risk/Reward |
|---|---:|---:|---:|---:
| Long (growth) | $5.9; confirmation by closing above $6.0 | $5.3 | $6.6; then $7.3 | 1:1.5–1:2 |
| Short (drop) | rejection from $6.6–$7.3 or break below $5.3 | $6.0 (for short from resistance) | $4.3; then $3.6 | 1:1–1:1.5 |
> Sources: .
---
Current technical state and levels
Short-term the market shows bearish signals: the price is below EMA on the daily chart, and indicators give mixed/bearish signals; key nearby support — around $5.39, if it falls below it further pullback down is possible. .
What to watch before entering a growth
- Confirmation: closing of the daily candle above $5.9–$6.0 with increasing volume.
- Indicators: RSI above 50 and positive MACD/crossing EMA(20) above EMA(50) will strengthen the signal.
- Targets: first target $6.6, next — $7.3; upon breaking $7.3, more aggressive targets can be considered. These levels are marked as important resistances in current market reviews. .
What to watch before entering a short
- Confirmation: rejection from the $6.6–$7.3 zone with a reversal candle or break down and close below $5.3 with increasing volume.
- Indicators: RSI in the declining zone, MACD for sale, and price remains below EMA — this increases the likelihood of continued decline. Upon breaking $5.3, the nearest targets — $4.3 and $3.6 based on weekly/monthly projections. .
Risk management and tactics
- Position size: do not risk more than 1–2% of capital on one trade.
- Stop-loss: set it clearly according to the plan (in the table) and adjust as price moves.
- Alternatives: for less risky entries use partial purchases upon trend confirmation or limit orders closer to support/resistance levels.
On the 1-hour timeframe UNI currently gives neutral-bearish signals; key levels for intraday trading — resistance around $5.41–$5.62 and support $5.26–$5.06; entry for growth after confirmed close above EMA/level with volume, entry for decline — upon rejection from resistance or break of support with confirmation of volume.
Current state 1h
- Overall picture: aggregated technical indicators on 1h show a neutral/selling balance — no clear strong bullish impulse, so it is better to trade on confirmed signals rather than 'blindly' by a single candle.
- Key levels (1h): resistance $5.41 (R1), $5.53 (R2), $5.62 (R3); support $5.26 (S1), $5.19 (S2), $5.06 (S3).
> Technical benchmarks: EMA20 around $5.82, EMA50 around $6.30; RSI on 1h leans towards neutral-bearish values, volatility is high — ATR ~8% (consider this for stops).
---
Specific entry points and stop-losses (1h)
- Long position (growth):
- Entry point: limit/market after closing the 1-hour candle above $5.62 with increasing volume or upon bouncing from $5.26 with confirmation of a bullish candle.
- Stop-loss: below local support — $5.19 (or ATR-based: 1.2×ATR below entry).
- Targets: first $5.82–$5.95 (short target at EMA20), second $6.30–$6.60 (EMA50/next resistance).
- Short position (drop):
- Entry point: upon rejection from the $5.41–$5.62 zone (bearish candle with volume) or upon break down $5.26 and close below.
- Stop-loss: above $5.62 (or 1.2×ATR above entry).
- Targets: $5.06, then $4.70–$4.30 if the momentum continues.
(All levels — benchmarks for 1-hour trading; adapt for spread and commission).
---
Confirmation signals and checklist before entry
- Candle confirmation: closing of the 1h candle in the direction of the trade + volume above average.
- Indicators: RSI >50 for long, <50 for short; MACD histogram confirms the direction; price relative to EMA20/50 (crossing strengthens the signal).
- Volume: increase in volume upon break/rebound — a key filter for false breaks.
- Risk management: do not risk more than 1–2% of capital on a trade; calculate position size using the formula: \(\text{Position} = \frac{\text{Risk per trade}}{\text{Entry} - \text{Stop}}\).
---
Execution tactics and trade management
- Use limit orders for entry at levels and stop-limit for protection.
- For partial exits set take-profits at levels; move the stop to breakeven after reaching the first target.
- In high volatility, it is preferable to trade on confirmed breaks and avoid 'catching knives'.
S. B. - "POINT DE RÉFÉRENCE"
- Your tips are a contribution to better service. Thank you!
