


Bitcoin price finds support around the key level at $85,569, where a steady close below indicates a deeper correction.
Ethereum price trades below $3,000 on Wednesday, extending its decline to four consecutive days.
XRP momentum indicators point to early bearish signals, suggesting additional downside risks ahead.
Bitcoin ($BTC ) and Ethereum ($ETH ) and Ripple ($XRP ) remain under pressure as the broader market continues in a correction phase until midweek. The weak price action of these three major cryptocurrencies in terms of market capitalization indicates a deeper correction, as momentum indicators have begun to tilt towards bearish.
Bitcoin could extend its correction if it closes below $85,569.
The price of Bitcoin was rejected from a downward trend line (drawn by connecting several peaks since early October) on Friday and has fallen about 7% since then, with a retest of the support level of $85,569 on Monday. However, BTC rebounded slightly on Tuesday after finding support at $85,569. As of this report on Wednesday, BTC is hovering around $87,300.
If BTC continues to correct and closes below $85,569 on a daily basis, which aligns with a 78.6% Fibonacci retracement, it may extend the decline towards the psychological level of $80,000.
The Relative Strength Index (RSI) on the daily chart is at 40, below its neutral level of 50, indicating that bearish momentum is gaining strength. Furthermore, the moving average convergence/divergence (MACD) lines are converging, and a shift to a bearish crossover would further support the bearish outlook.
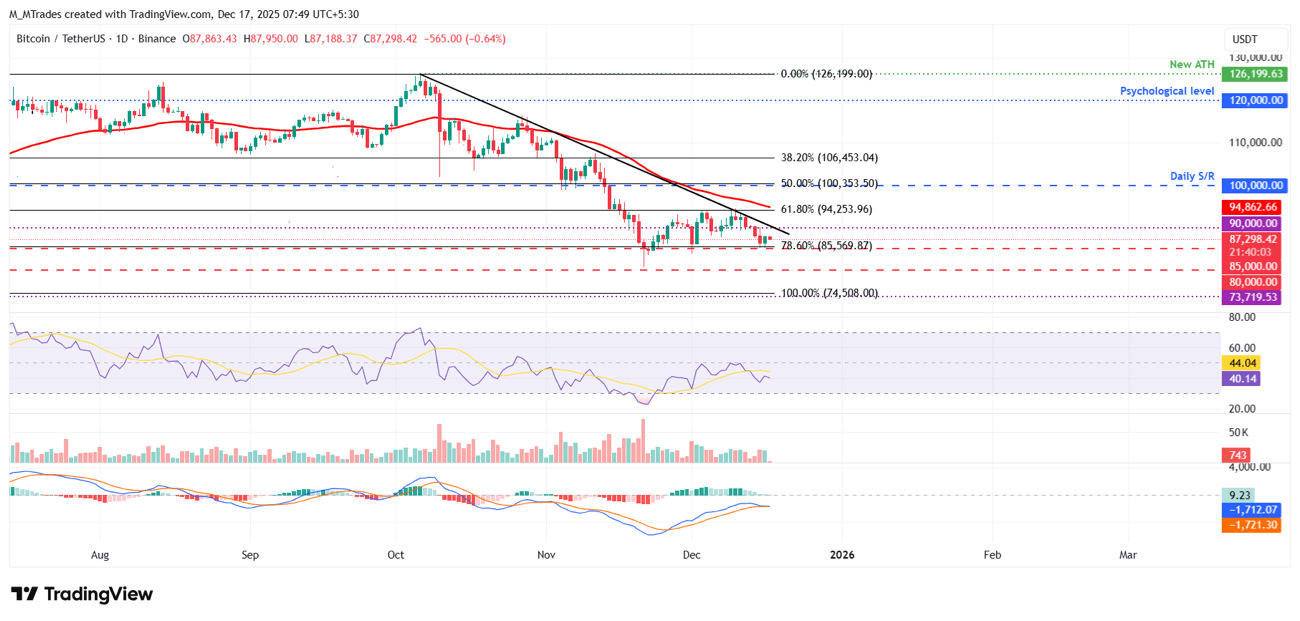
The daily chart for the BTC/USDT pair
If BTC recovers, it may extend the rise towards the 61.8% Fibonacci retracement level at $94,253.
Ethereum momentum indicators are showing bearish signs.
The price of Ethereum failed to close above the 50-day exponential moving average at $3,249 on December 10 and fell by 11% by Tuesday. As of Wednesday, ETH continues to decline, trading below $2,946.
If ETH continues to correct, it may extend the decline towards the next support at $2,749.
The Relative Strength Index on the daily chart is at 41, below its neutral level of 50, indicating that bearish momentum is gaining strength. Additionally, the MACD shows a bearish crossover on Wednesday, further supporting the negative outlook.
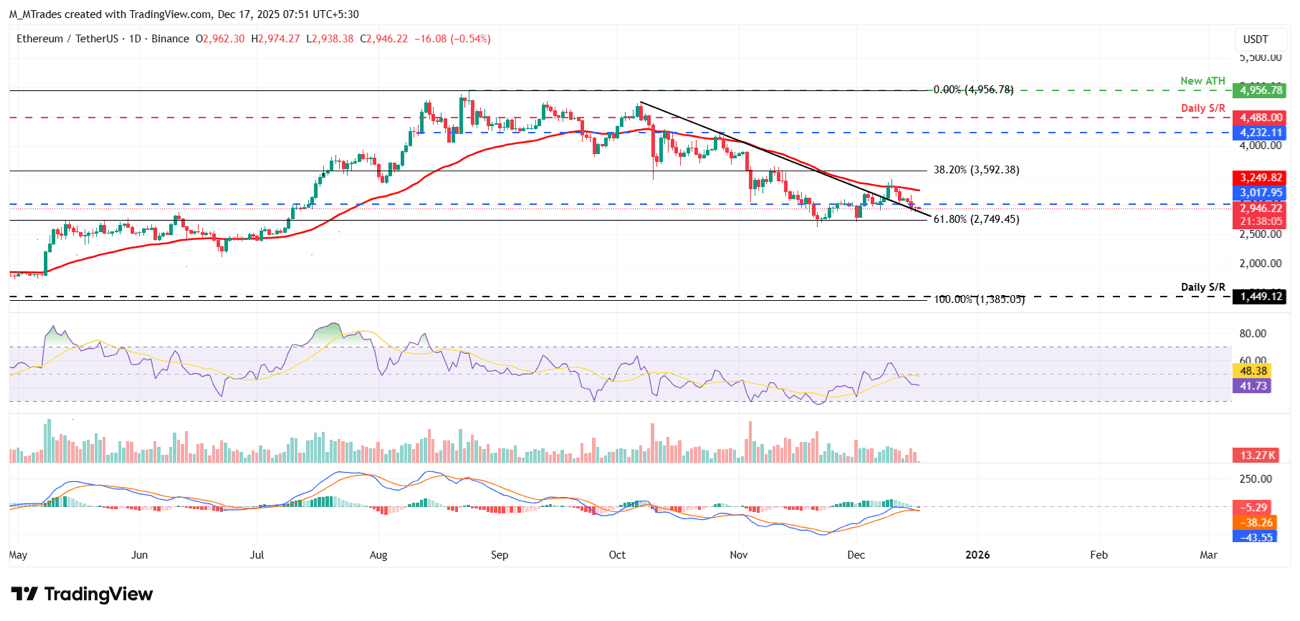
The daily chart for the ETH/USDT pair
On the other hand, if ETH recovers, it may extend the recovery towards the 50-day exponential moving average at $3,249.
Bears are targeting XRP at $1.77 as it closes below key support.
The price of XRP has decreased for the second consecutive week by 3.22%, with a retest of the key daily support at $1.96 on Sunday. As of this week, on Monday, XRP continues to correct and closes below this support level. However, on Tuesday, XRP rebounded slightly, and as of Wednesday, is hovering around $1.91.
If XRP continues its decline, it may extend the drop towards the next daily support at $1.77.
The Relative Strength Index on the daily chart is at 37, below its neutral level of 50, indicating that bearish momentum is gaining strength. Additionally, the MACD indicator also showed a bearish crossover on Sunday, which is still in effect, further supporting the bearish thesis.
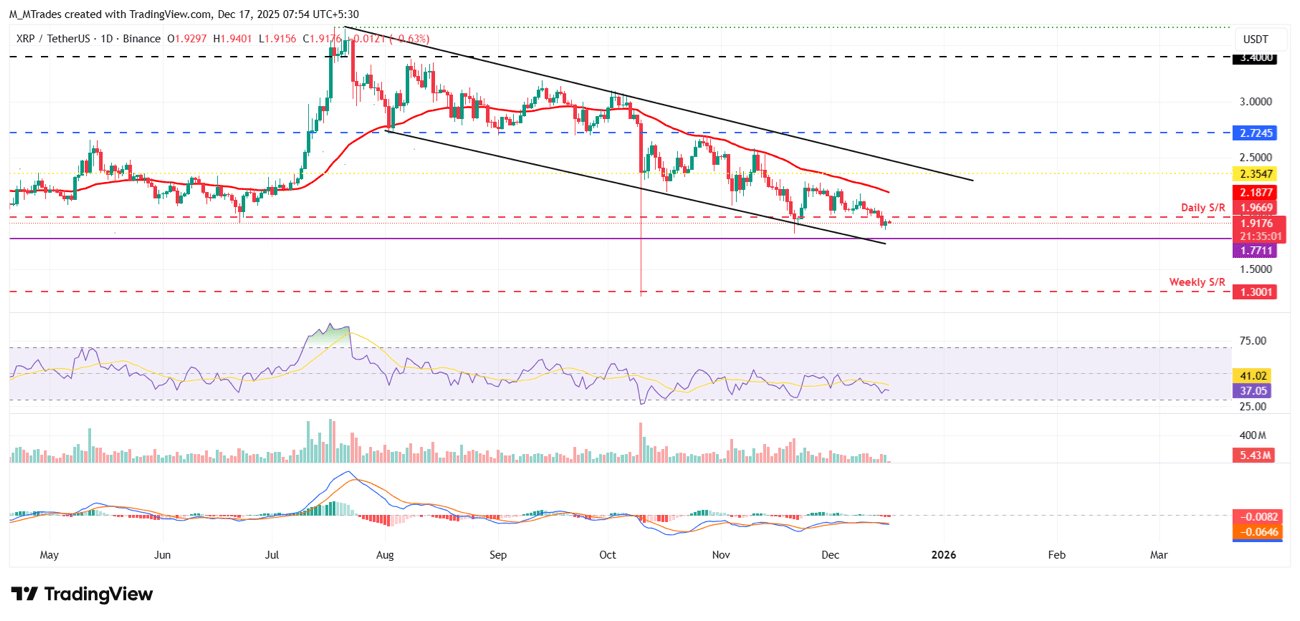
The daily chart for the XRP/USDT pair
However, if XRP recovers, it may extend the rise towards the daily resistance level at $1.96.