Ethereum ($ETH ) is showing positive signs after the recent strong correction. Below is a quick analysis based on the 1H chart for you to refer to for short-term LONG positions.
🔍 Technical Analysis:
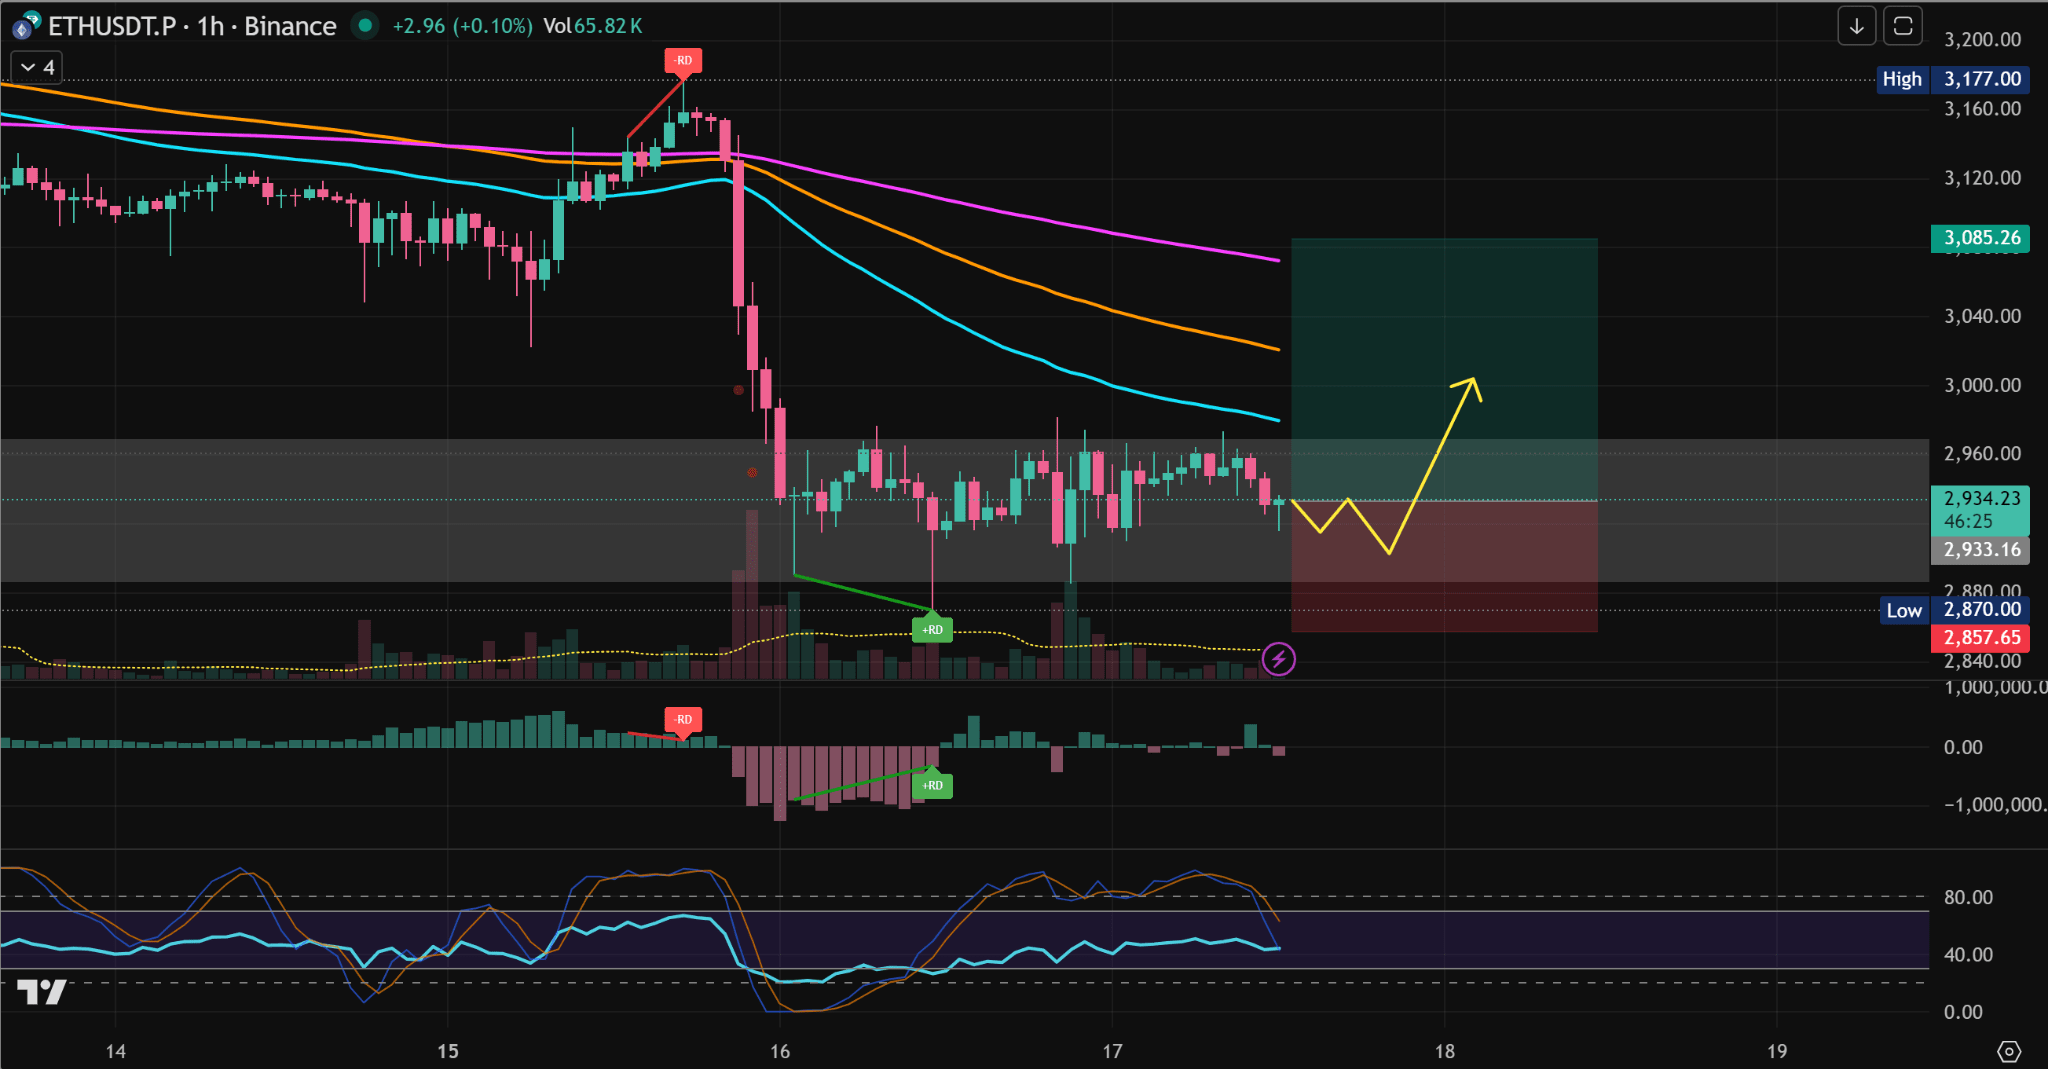
Strong Support Zone: The price is moving sideways, accumulating in the range of 2.900 - 2.960. This is an important demand zone that has kept the price from dropping deeper after the previous dump.
Bullish Divergence (+RD): Observe closely, we see the signal of Regular Bullish Divergence. While the price creates lower lows or moves sideways, the momentum indicators (like RSI or money flow) create higher lows. This is an early signal indicating that the selling pressure has weakened.
Supporting Indicator:
MACD: The histogram has started turning green and the signal line is trending upwards, supporting the recovery momentum.
Stoch RSI: Currently in the oversold zone and starting to trend upwards.
🎯 Trade Plan:
Based on the drawing "Long Position" on the chart:
Entry Zone: Around the current price level or wait for a slight test at the range of 2.920 - 2.935. (According to the yellow arrow in the image, the price may dip slightly before bouncing up).
Stop Loss: 2.870. (Set just below the lowest recent candle wick to avoid liquidity sweep).
Take Profit:
TP 1: 3.000 (Psychological resistance zone & short-term EMA line).
TP 2: 3.085 (Top of the green box in the image - Confluence area with medium-term purple/orange EMA lines).
⚠️ Note:
The market is experiencing strong fluctuations, the main trend on the larger frame still requires caution.
This setup is of the Scalping/Day Trading type that takes advantage of mean reversion.
Always adhere to capital management (R:R > 2.5 for this trade).
What do you think about this trade? Will $ETH recover the 3k1 mark soon? Leave a comment below! 👇
#BinanceSquare #ETH #CryptoTrading #TechnicalAnalysis #LongSetup