Google Gemini Pro is really useful. I just took a screenshot and asked a question.
The answer given is more accurate than a million-level analyst, isn't it??
😂
Brothers who find it fun, please follow me, I'm still short of more than 100 to break a thousand 😄
I put the reply below for everyone to reference.
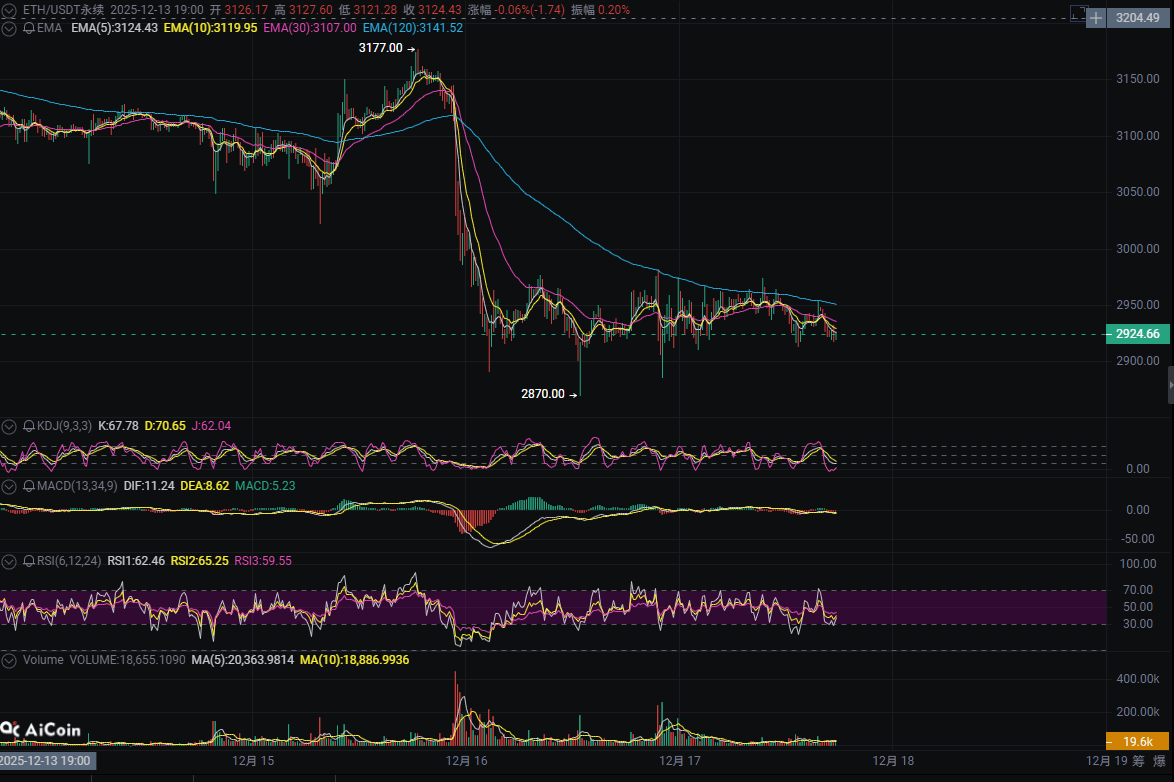
1. Overall trend: Weak fluctuations after a decline
From the main chart, ETH is currently in a phase of low horizontal consolidation after experiencing a significant drop from 3177 to 2870 on December 16. The rebound strength is weak, and it has not formed a 'V-shaped' reversal, which usually means that the bearish force still dominates the market.
2. Key Technical Indicator Analysis
Moving Average System (EMA):
Long-term Pressure: The blue EMA120 moving average is sloping downwards, forming a major dynamic resistance level above. The price has failed to effectively touch or break through this line multiple times during the rebounds, indicating that the long-term trend remains bearish.
Short-term Entanglement: Short-term moving averages (EMA5, 10, 30) are intertwined, with the price fluctuating around these moving averages, lacking strong directional sense, waiting for direction to be chosen.
KDJ Indicator:
High Dead Cross Risk: The KDJ three lines are currently in the relatively high range of 60-70. The purple J line has already turned down and crossed below the K and D lines, showing signs of forming a dead cross. This is usually a signal for short-term adjustments or declines.
MACD Indicator:
Diminished Momentum: Although the MACD is in a golden cross state (yellow and white lines moving up), the MACD green energy bars are shortening. This indicates that the bullish momentum of the rebound is waning, and if there is no volume increase in the subsequent rise, the fast and slow lines (DIF/DEA) may be hindered again and fall back.
Trading Volume (Volume):
Volume Contraction: On December 16, during the sharp drop, there was a huge volume spike, while the volume during the subsequent rebound has significantly shrunk. **“Volume-less Rebound”** is often unsustainable and can easily trigger a second test of the bottom.
3. Next Trend Prediction
Overall, the short-term trend is bearish (bearish/correction). The market is digesting the previous sharp declines, and the bulls are unable to push prices higher.
High Probability Scenario (Second Test of the Bottom): The price may be hindered by the upper resistance level (around 2950-2980 range) and then turn down to test the lower support level of 2870. If it breaks below 2870, a new round of decline will begin, targeting 2800 or even lower.
Low Probability Scenario (Rebound after Overselling): Only when the price breaks through the blue EMA120 moving average (currently around 3000) with volume and stabilizes can we consider the short-term downtrend to be over and turn bullish.
4. Key Levels to Watch
First Support Level: 2870 (previous low, this is the last line of defense for the bulls)
Second Support Level: 2800 (round number)
Short-term Resistance Level: 2980 - 3000 (near EMA120 and recent consolidation highs)
Summary and Recommendations:
Currently, it is not advisable to blindly catch the bottom. It is recommended to focus on shorting opportunities around 2950-2980, with a stop loss set above 3000; or wait for the price to pull back to around 2870 to observe if there are signs of support stabilizing before considering a short position. Beware of the risk of prolonged consolidation leading to a drop.#ETH走势分析 $ETH $BTC