Brothers, I am Mig.
Does today's market feel like riding a fake roller coaster—SOL swaying to the threshold of 130, but before it could stabilize, it turned down?
Don't worry, I will combine the CPI news coming out tomorrow with the key signals from the 4-hour chart to clarify the script for the future market.
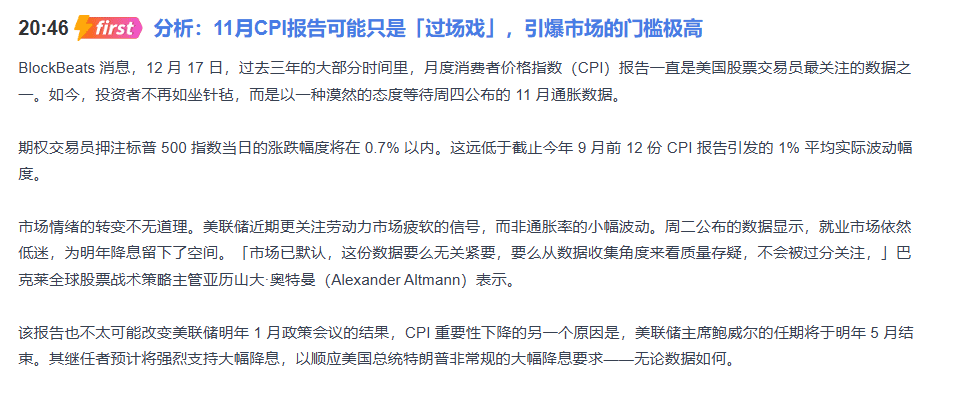
In-depth analysis of the news—it's the 'silence' before the storm that is the most terrifying.
Why is the market 'lying flat' before major data? Behind this are three layers of expectations:
The Federal Reserve's 'hidden card' seems clear: whether the CPI is slightly hot or slightly cold, as long as the job market shows signs of weakness, the core task for the Federal Reserve next year may be 'preventing recession' rather than 'fighting inflation'. Traders believe that data is unlikely to change this broad trend of easing.
Political cycle overwhelms data cycle: Trump's call for interest rate cuts is getting louder, and Powell's term is entering the countdown. This means that the main policy axis for 2024 is likely to be 'in line with interest rate cuts'. A single CPI data cannot temporarily overturn this big ship.
The market's true mentality: this 'indifference' itself is a signal — institutions do not believe tonight's data will bring a trend market; they may be waiting for clearer policy shift signals. But for us retail investors, this low volatility expectation is often an 'illusion'; once the data is unexpected, it can easily trigger a violent 'double kill' of bulls and bears.
Technical precision positioning — 4-hour chart enters the 'triangle convergence' ultimate choice
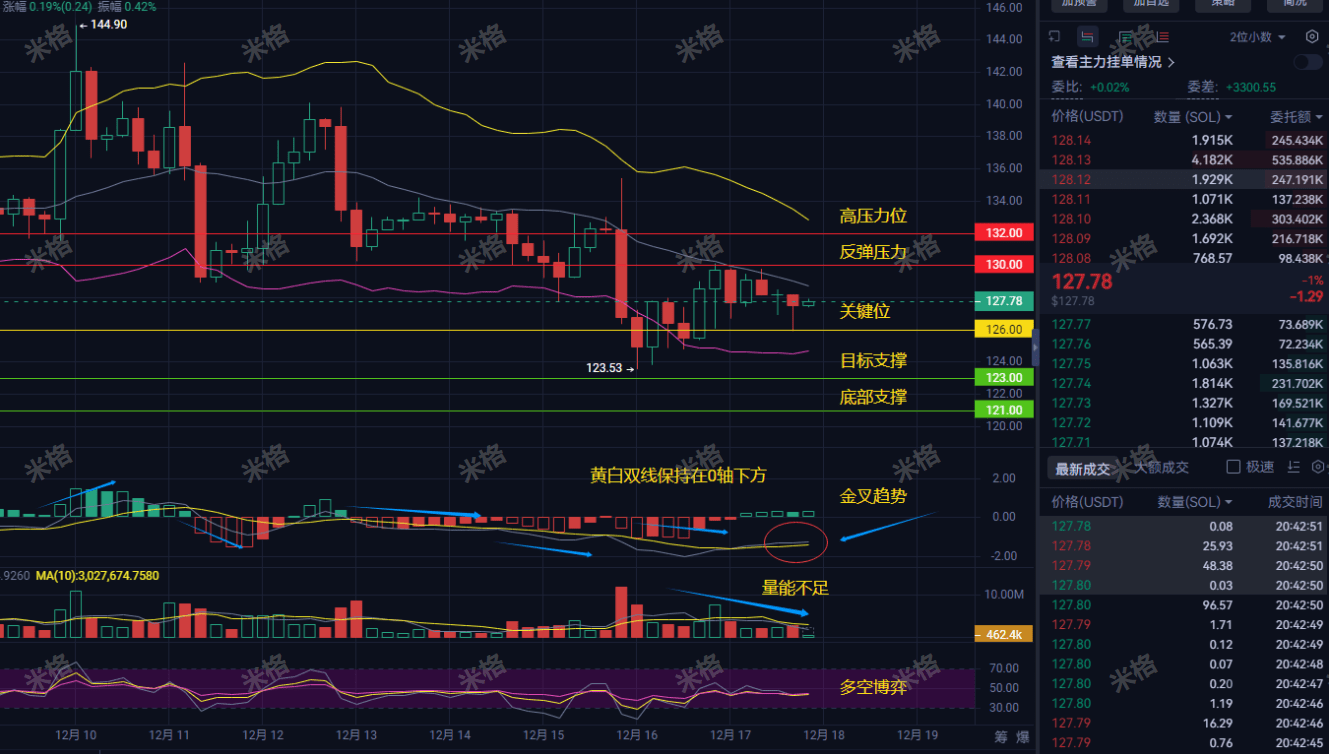
Looking at SOL's 4-hour chart, the pattern is actually very clear; the price is compressed into an increasingly smaller space:
Upper 'high pressure line': 130-132 area, multiple rebounds have been precisely suppressed here. This is not only a technical pressure, but also a strong and weak watershed in market psychology. If it does not pass here, all rises will be treated as rebounds first.
Lower 'lifeline':
First defense line (126-127): Recently tested multiple times, this is the last face of the short-term bulls.
Ultimate defense line (121-123): This is the key support area of the bottom structure. If it breaks down with volume, the downward space will be completely opened, and the next target may rush directly to the 115-118 area.
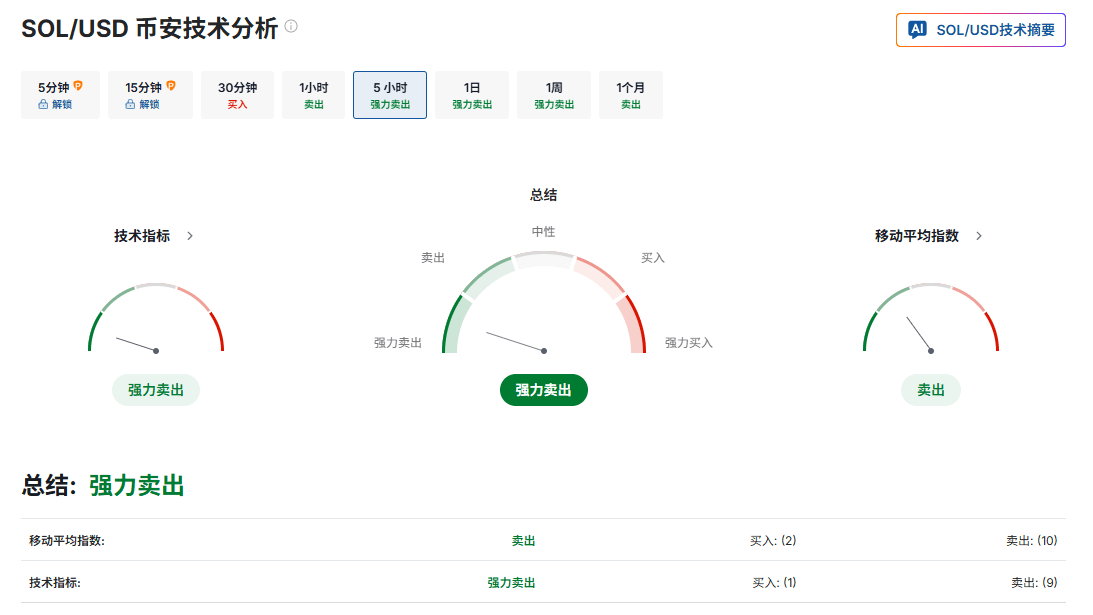
The indicators hide a deadly intent: MACD is close to the 0 axis, and volume continues to shrink. This is a typical characteristic of the 'pre-choice direction' stage. The yellow and white lines are sticking at the bottom, and the death cross risk has not been eliminated.
MIG simulation — two scripts before and after tonight's data
My judgment is that before the data is released, the market is likely to maintain a weak oscillation, and the rebound is an opportunity for you to adjust your position.
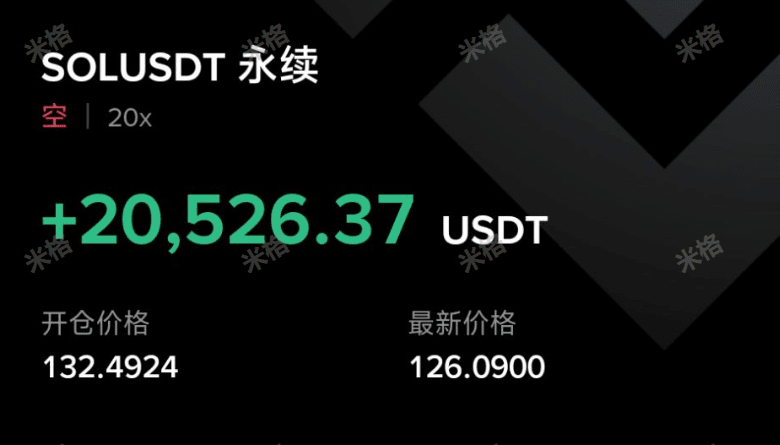
Scenario One (Data meets or falls below expectations, with little volatility): The market will continue to oscillate and consume between 126 and 130. But remember, as long as the price cannot stabilize above 132, the probability of ultimately choosing to break down after the oscillation remains high. In terms of operations, a rebound to the 129-130 area is still an opportunity to reduce positions or manage risks.
Scenario Two (Data unexpectedly exceeds expectations, triggering panic): If the data is strong, it may temporarily impact market interest rate cut expectations. SOL is very likely to directly test the ultimate support area of 123-121. This will be the battlefield for the bulls and bears. If it holds, there is hope to build a bottom; if it fails, the trend will turn bearish, and risks must be avoided decisively.
The only reversal signal: only when there is a strong volume breakthrough and stabilization above 132 can the current weak pattern be reversed and upward space opened.
Practical guide for retail investors tonight
Before the data release: treat all as rebounds. Those with heavy positions should reduce positions near 129-130 during the rebound. Those with no positions, please hold back and don’t try to reverse before the data.
At the moment the data is released: do not chase up or down! Wait for the first wave of market sentiment impact to pass (usually 15-30 minutes) and see if the price chooses to break up above 130 or break down below 126.
After the data is released:
If the volume breaks 132, consider a small position to follow up, with a stop loss set below 130.
If the downward trend breaks 126, do not bottom fish decisively, the next target is 123-121.
If a large volume support appears in the 121-123 area, a small position can be taken to test the rebound, but a stop loss must be set.
Brothers, based on my multi-dimensional on-chain data and market monitoring system, I have already found signs of large funds quietly preparing near the key support area. This usually means that regardless of the data results, the market may show a clear short-term direction in the next 48 hours. At the first moment this direction appears, I will provide an urgent alert and strategy deployment in the village.
If you don't want to become a passive victim of volatility, if you also want to seize the potential 'golden starting point' that may appear after the data lands, then paying attention to MIG is the most important thing you can do now, and it is also the only correct action. I am here not just to give you conclusions, but to help you understand the market's bottom cards.
Pay attention to MIG; tonight, we will understand the data together and win the decisive battle!
