
Date: Wed, Dec 17, 2025 | 03:00 PM GMT
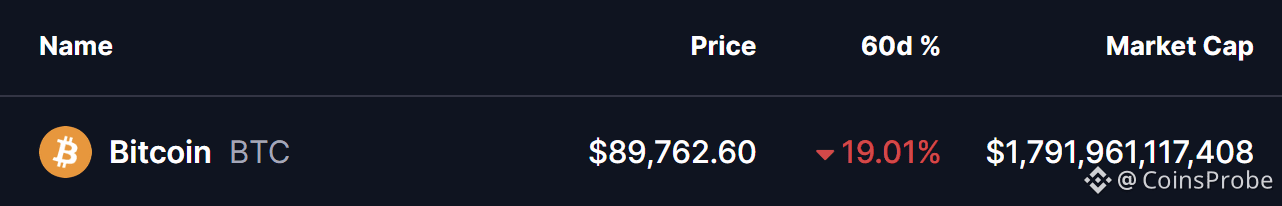
The broader cryptocurrency market has been experiencing choppy price action over the past several weeks, a phase that began after the sharp sell-off on October 10. That correction dragged Bitcoin (BTC) from sub-$120,000 levels down toward the current $88,000 zone. Over the last 60 days alone, $BTC has declined by 19%, keeping overall market sentiment cautious and risk appetite subdued.
Despite the weakness, the higher-timeframe chart is beginning to reveal a familiar technical structure. Price behavior now suggests that downside momentum may be fading, raising the possibility that Bitcoin could be preparing for a trend reversal rather than a continuation of the recent decline.
Fractal Setup Hints at a Potential Bottom
According to crypto analyst JAVON, BTC’s current price structure is closely resembling a repeating fractal that has appeared multiple times throughout the ongoing macro uptrend. Historically, Bitcoin has followed a consistent rhythm: a sharp impulsive rally, followed by a corrective phase marked by consolidation and lower highs, before resuming its broader upward trajectory.
Looking at the chart, BTC has repeatedly formed local distribution patterns near highs, followed by controlled pullbacks into strong support zones. Each of these pullbacks eventually transitioned into consolidation ranges, where selling pressure gradually weakened before buyers stepped back in aggressively. These phases ultimately served as accumulation zones rather than trend reversals.
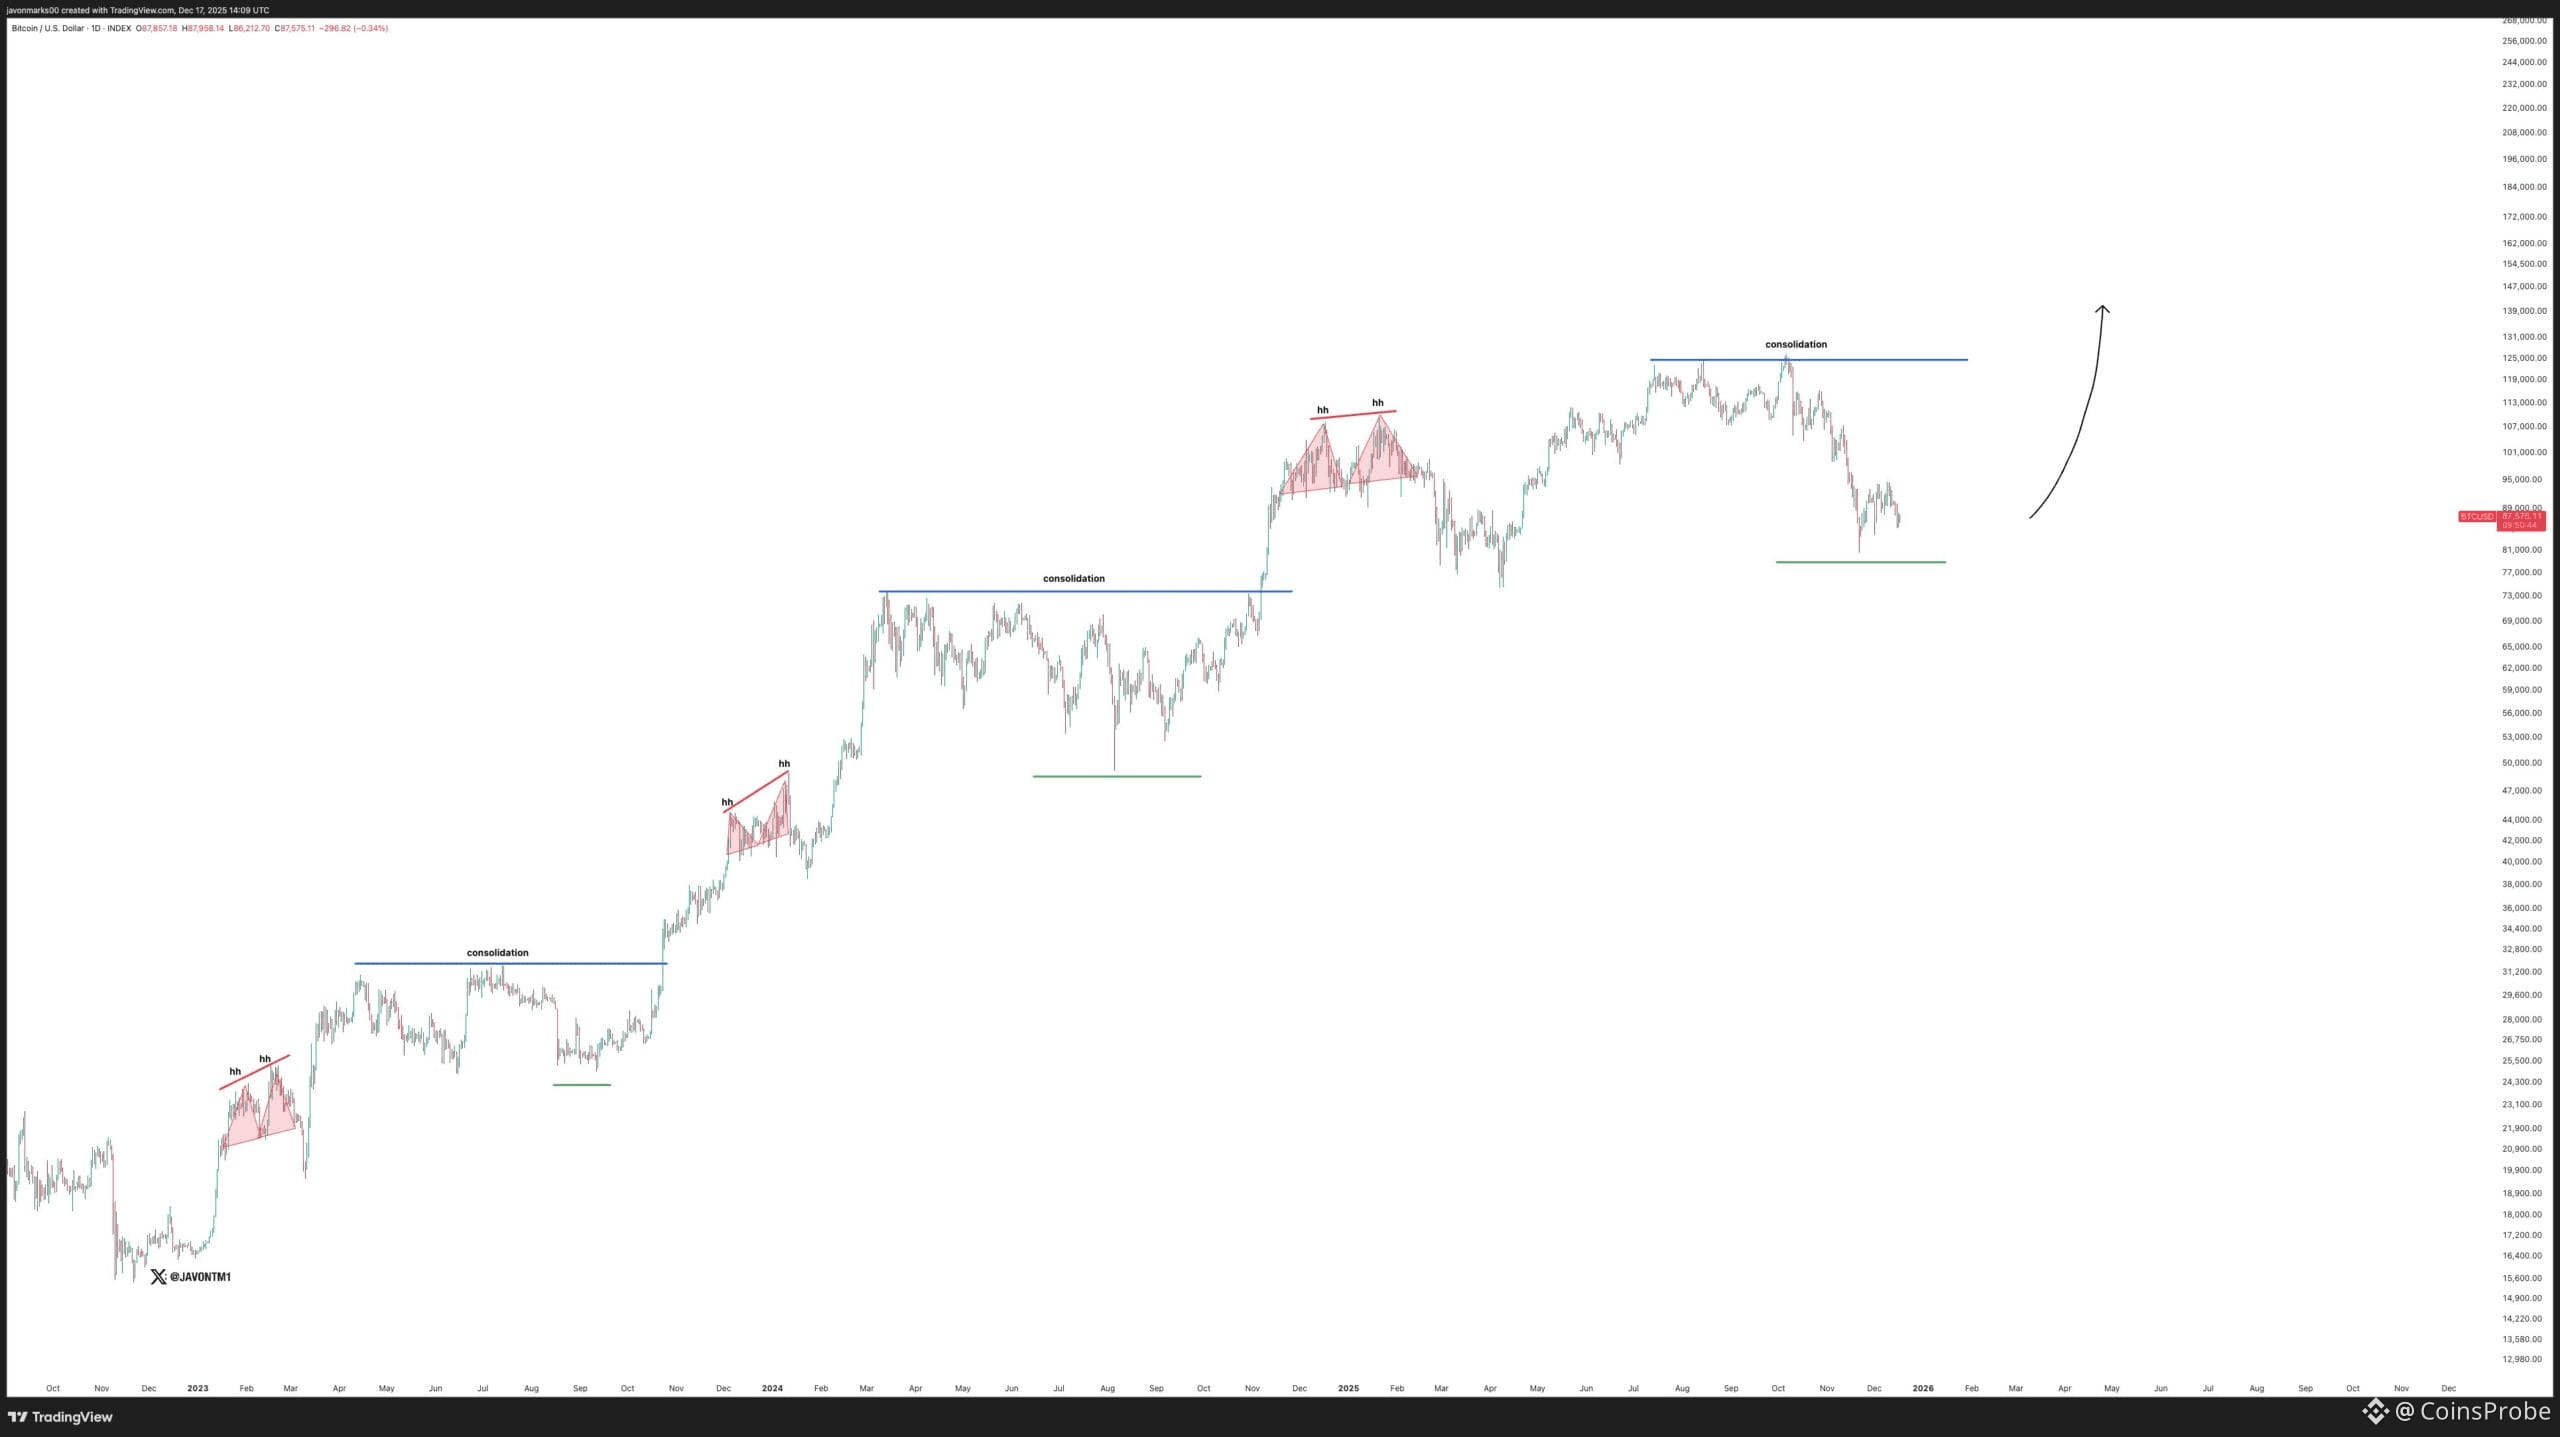 Bitcoin (BTC) Fractal Chart/Credits: @JavonTM1 (X)
At present, Bitcoin appears to be replaying the same script. After topping out near the $126,000 region, BTC entered a corrective decline that has now brought price back into a historically significant demand area around the $80,000–$88,000 range. This zone aligns closely with prior consolidation bases seen earlier in the cycle, where price previously paused before launching into its next leg higher.
Notably, the current pullback remains structurally healthy when viewed in the context of the broader trend. Higher-timeframe support is still intact, and the decline so far resembles past corrective phases rather than panic-driven breakdowns. This fractal similarity suggests that Bitcoin may be carving out a local bottom, rather than entering a prolonged bearish phase.
What’s Next for BTC?
If this fractal continues to play out as it has in previous cycles, Bitcoin could spend additional time consolidating above the current support zone before attempting a trend resumption. A period of sideways price action would allow market conditions to stabilize, flush out remaining weak hands, and rebuild bullish momentum.
A confirmed recovery above the recent consolidation resistance would strengthen the case for a renewed upside move, potentially opening the door for BTC to revisit and eventually exceed its prior highs. On the other hand, a sustained breakdown below the current support region would weaken the fractal thesis and signal that a deeper corrective phase may still be unfolding.
For now, Bitcoin’s structure remains constructive despite recent volatility. As long as BTC continues to hold above key higher-timeframe support levels, the probability of a cyclical bottom forming remains elevated. Traders and investors will be watching closely to see whether this familiar fractal once again leads to the next major expansion phase.
Disclaimer: The views and analysis presented in this article are for informational purposes only and reflect the author’s perspective, not financial advice. Technical patterns and indicators discussed are subject to market volatility and may or may not yield the anticipated results. Investors are advised to exercise caution, conduct independent research, and make decisions aligned with their individual risk tolerance.
