
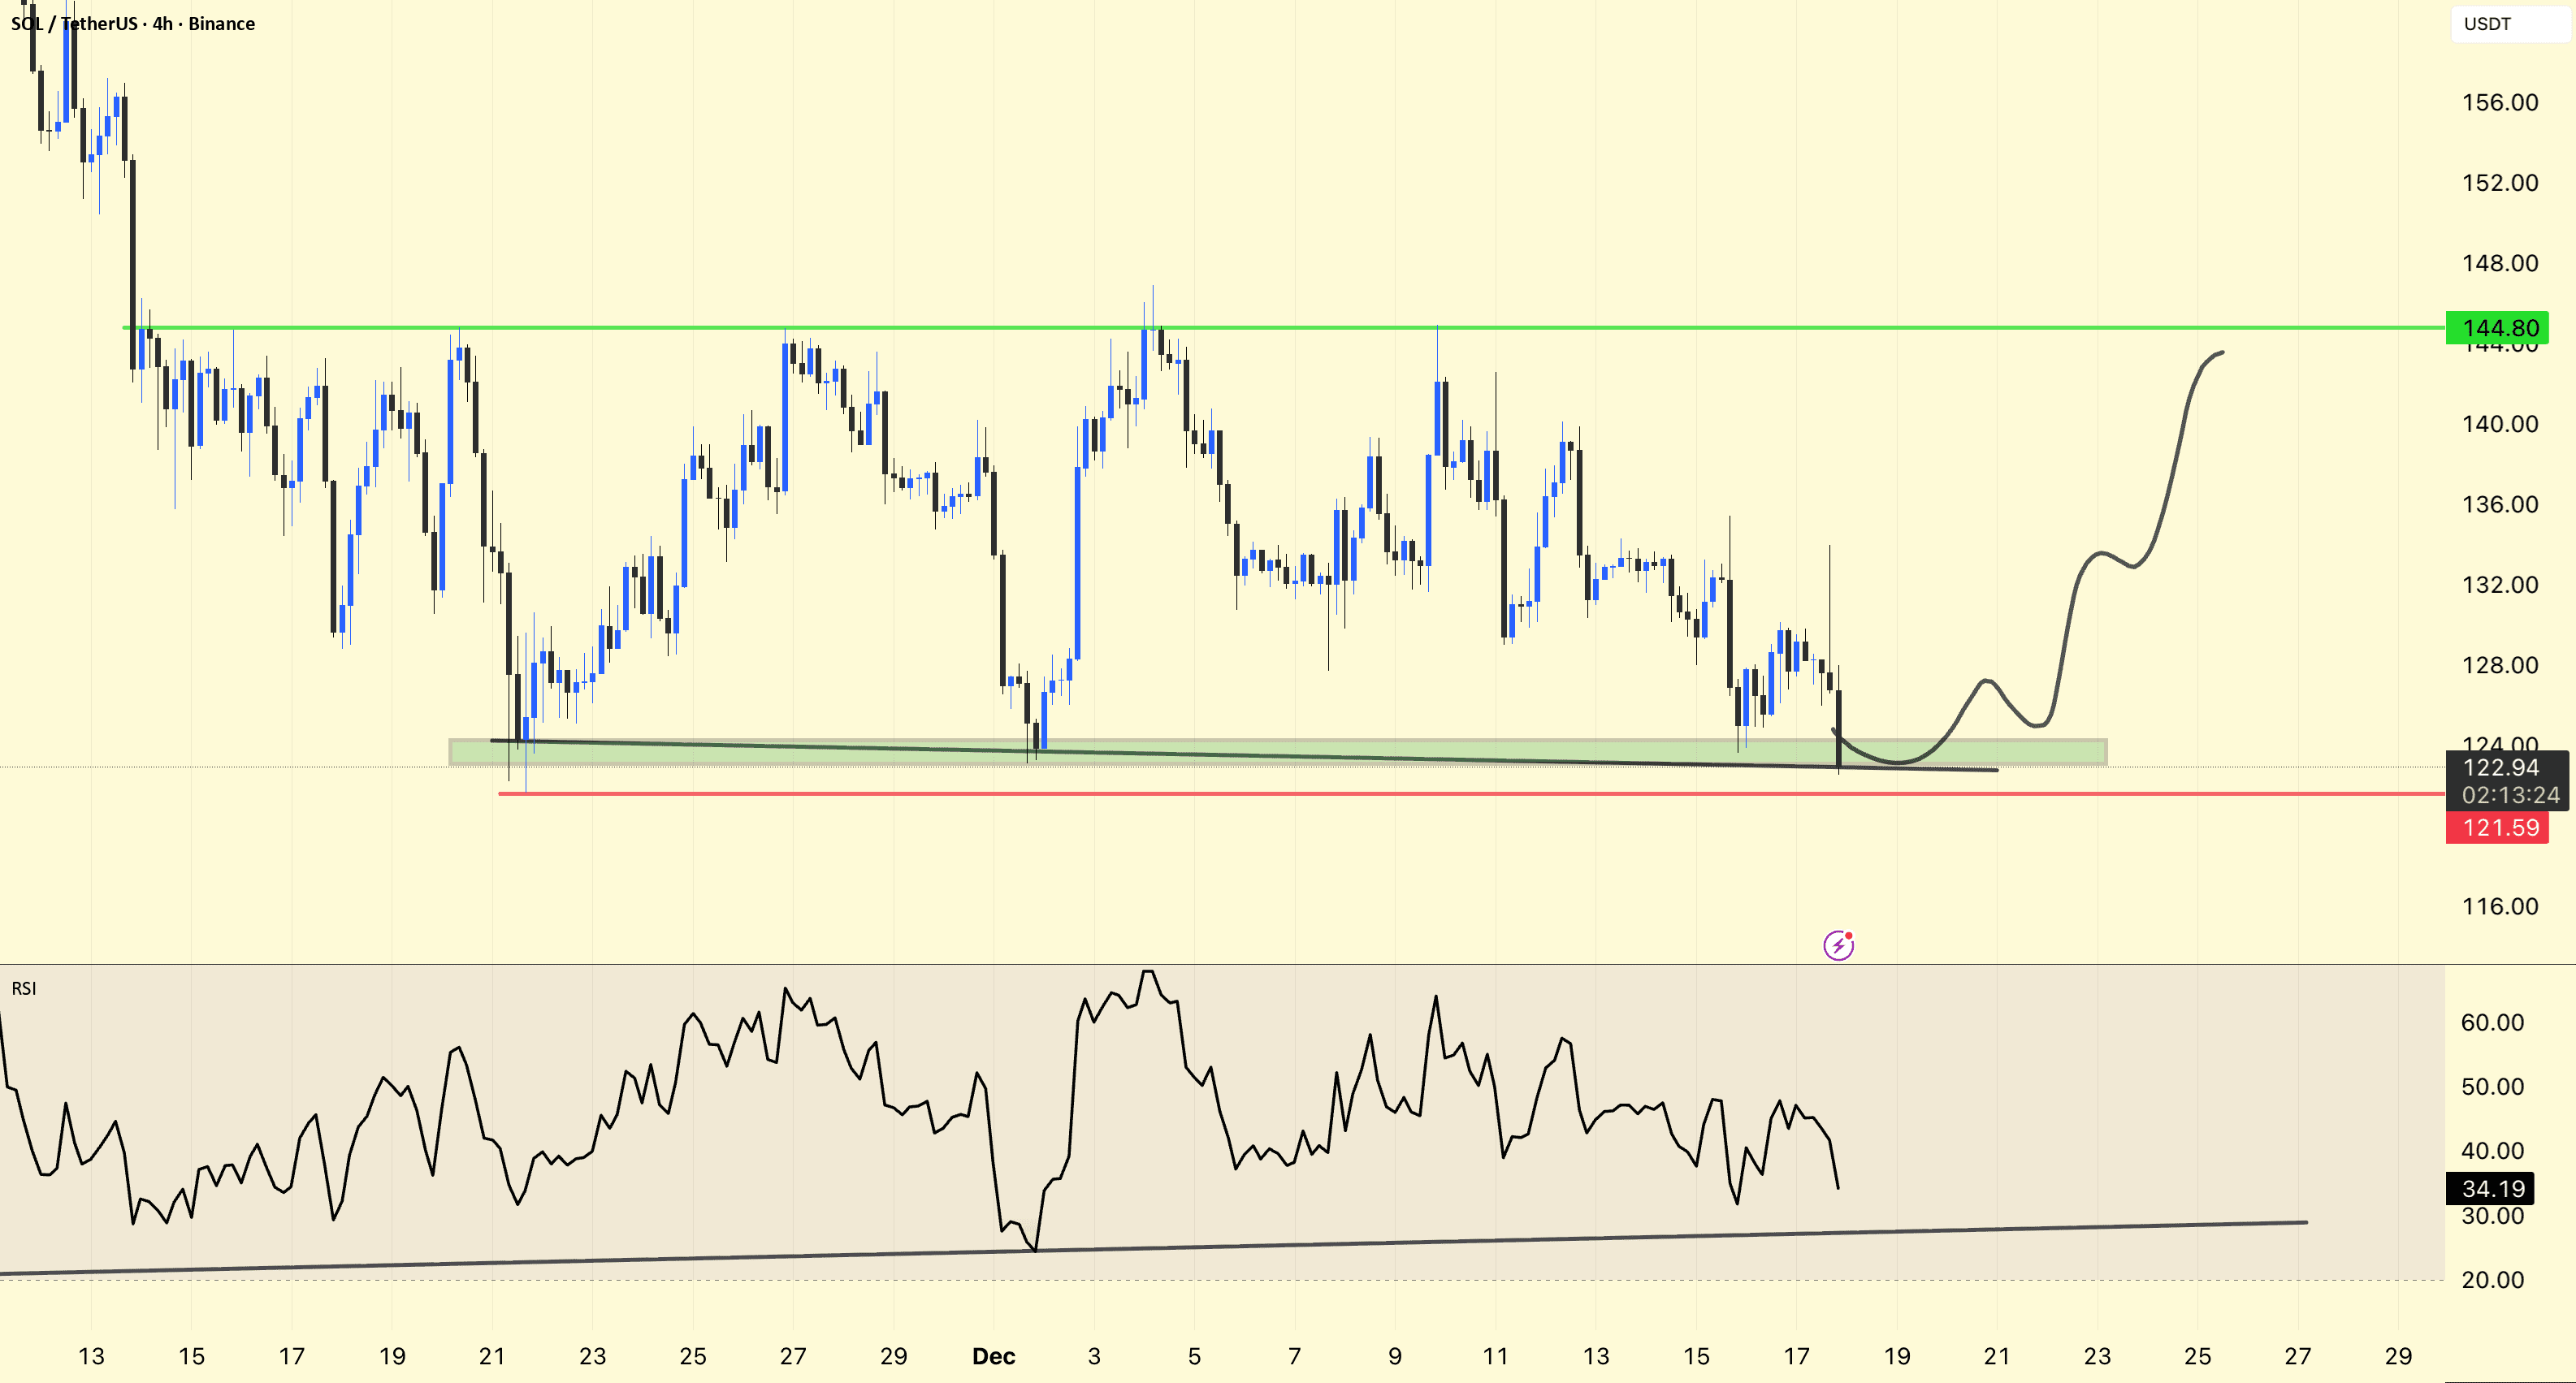
 SOL is currently trading within a high probability demand zone (123–121) that has been tested multiple times. Price pressure at this base indicates that sellers are exhausted, and a potential upward reaction is possible.
Trading plan
Potential entry zone: 123 – 121
Potential targets:
T1: 132 – 135
T2: 140 – 145 (Major resistance and range high)
Technical analysis
Strong horizontal support: Multiple reactions confirm that buyers are active.
RSI ~35: Near the oversold area → increases the likelihood of a rebound.
Liquidity sweep: A candle reversal below support indicates a stop-hunt before the reversal.
Structure: Downward trend momentum is slowing; visible base formation.
⚠️ Disclaimer:
This analysis is for educational purposes only and does not encourage trading in futures or any prohibited transactions. The goal is to illustrate potential market movement, not a direct recommendation to buy or sell.
💡 Important notes:
- This analysis is for educational purposes only.
- Please study the market and make decisions based on your ability and risk tolerance.
- The author is not responsible for the trading of others or their profit outcomes.