
#Bitcoin #BTC #BTCUSDT #BTC走势分析
Let's compare the present recovery period to August 2024 to see what we can find. I know uncertainty can run high as soon as there is a retrace because of the recent correction. We won't accept Bitcoin as being bullish unless prices are trading above $95,000 or $100,000, but the truth is that bullish potential develops right after a major low.
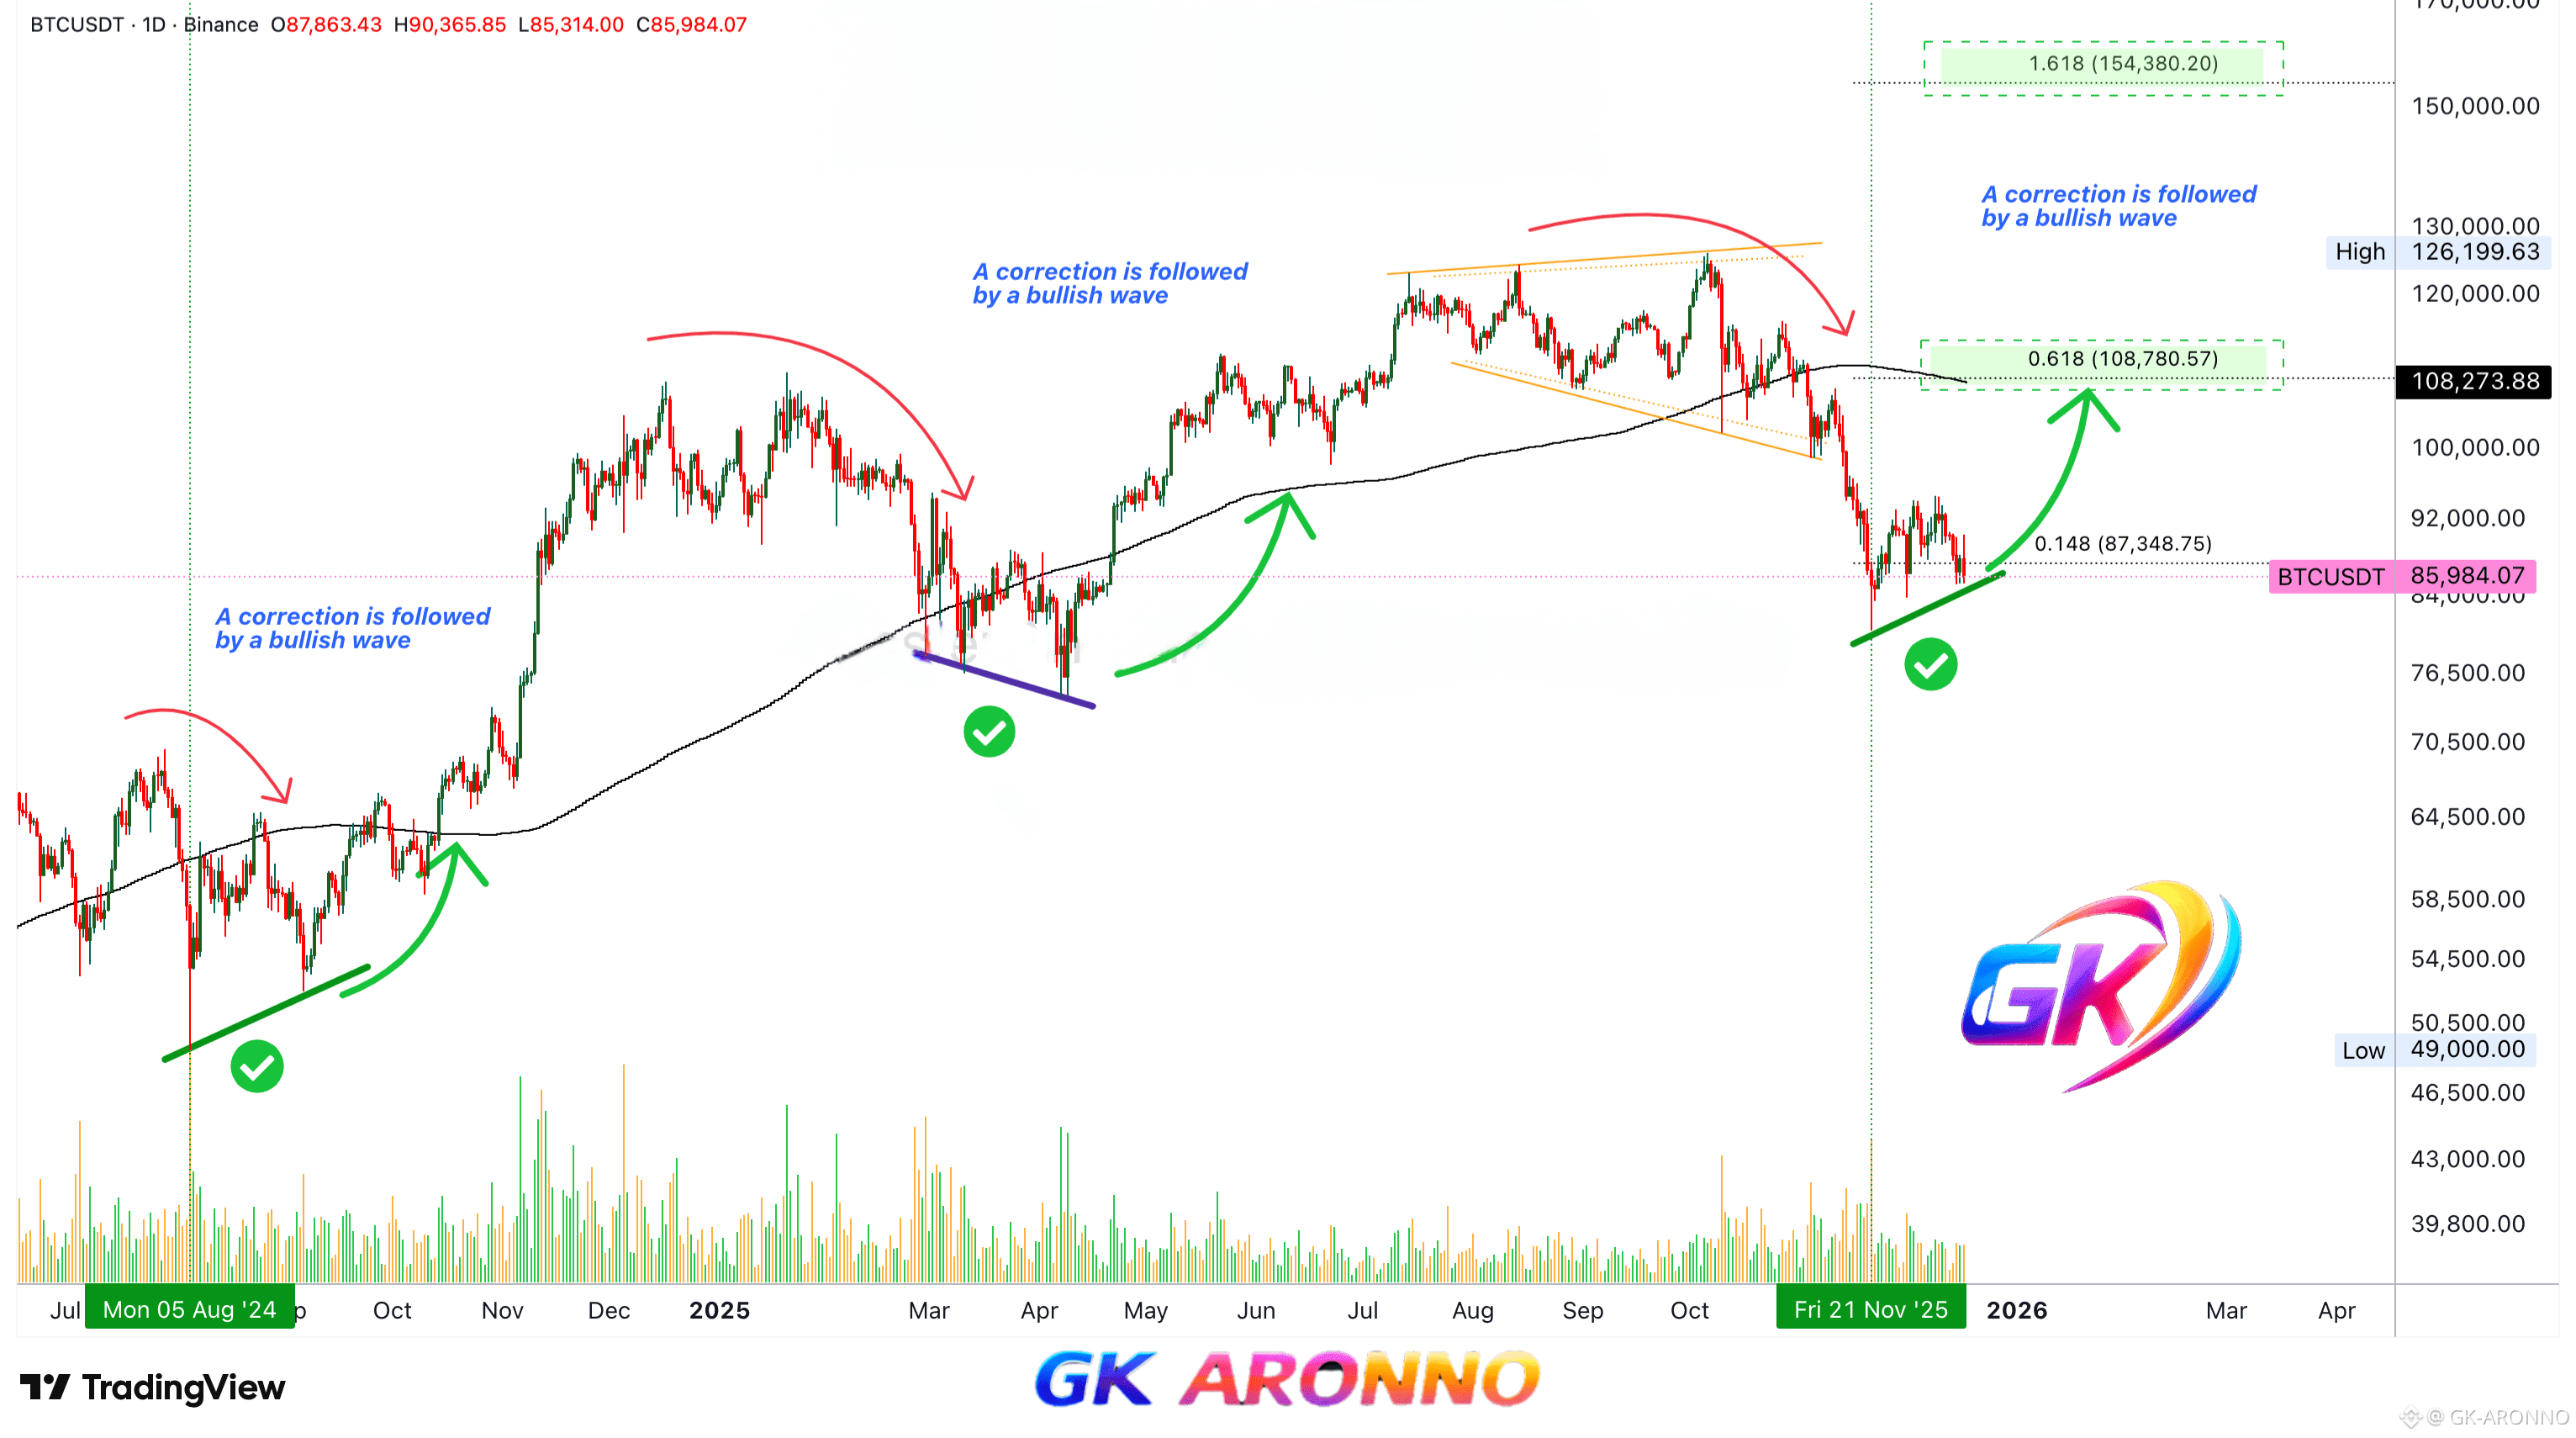
Last year Bitcoin produced a correction from a major high and hit bottom in August 2024. This was a major flush and here many people were caught by surprise. The chart is very similar today. Bitcoin hit a new all-time high and then entered correction mode. The low 21-November 2025 would be an analog to the low 5-August 2024.
The action moved below MA200 daily, just as it is happening now and a recovery happened within 20 days. After 20 days, Bitcoin challenged MA200 with a rejection producing a higher low. This was 2024. The higher low led to additional growth.
In 2025, Bitcoin grew 18 days after the low 21-Nov and then we have a retrace and higher low. It took a total of 84 days, almost three months, for Bitcoin to challenge its highest price before the correction. In today's terms, 84 days would put us at around 13-February 2026 for Bitcoin to move back to $126,000. Assuming this level will be challenged.
When it comes to the broader picture there is a big difference between this year and last year. When we look at the monthly timeframe and some indicators, market conditions are not the same. But a relief rally is already underway and this is our concern right now.
Once the bottom is in, market sentiment hits the lowest at "extreme fear." But while pessimism permeates the market and the sentiment is low this is always the bottom, and the bottom means lower no more. From the bottom we grow.
This chart clearly shows: "a correction is followed by a wave of growth."
Namaste.
✅ Trade here on $BTC
