Executive Summary
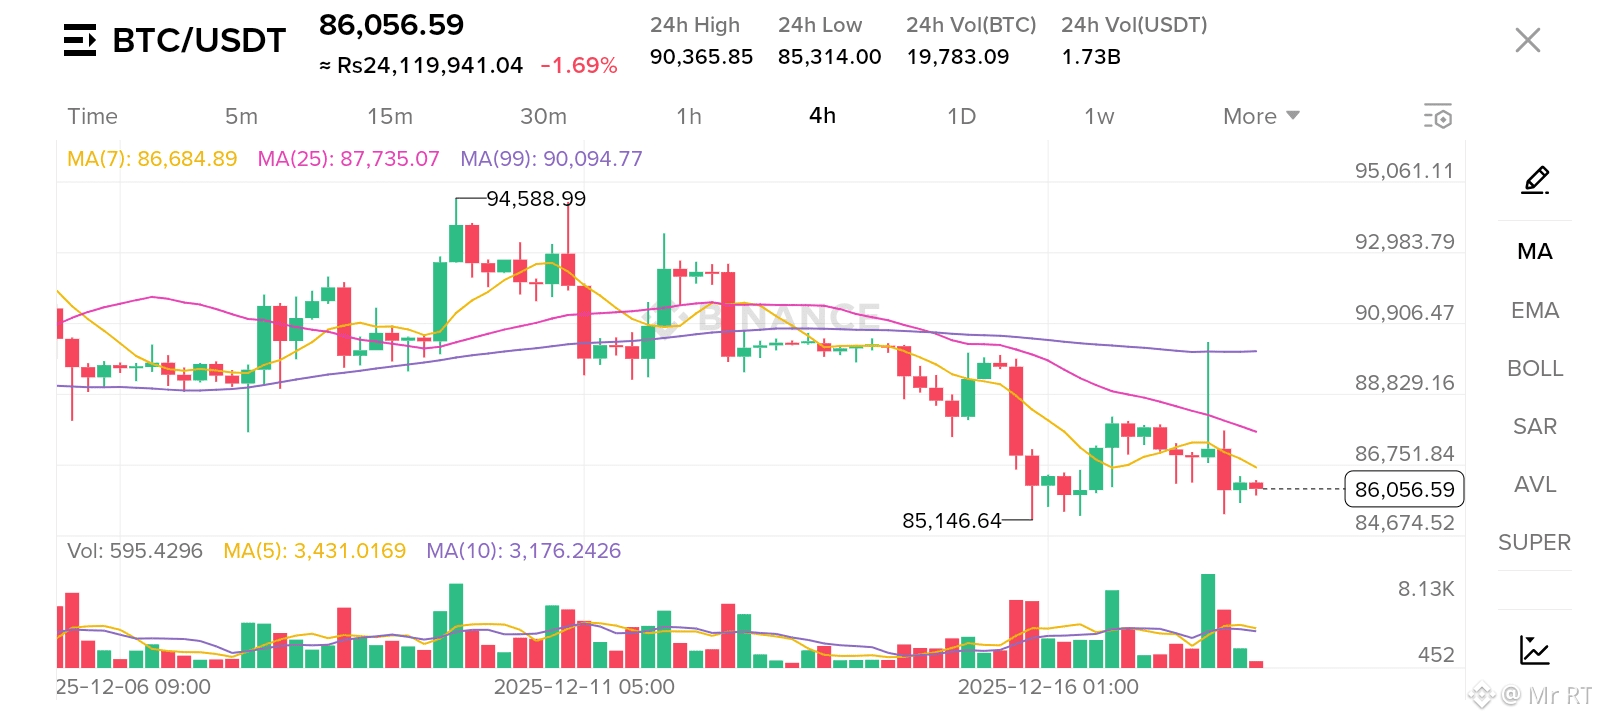
The Bitcoin ($BTC )chart exhibits a bearish trend in the 4-hour (4h) timeframe. After failing to maintain the $94,588 peak, the price has entered a descending structure characterized by lower highs and lower lows. Current sentiment in the broader market is leaning toward "Extreme Fear," which often precedes either a final capitulation or a bottoming-out phase.
Technical Indicators Analysis
1. Moving Averages (MA)
The price is currently trading below all three major moving averages shown on your chart:
* MA(7) - Yellow: ~$86,684 (Short-term resistance)
* MA(25) - Pink: ~$87,735 (Medium-term resistance)
* MA(99) - Purple: ~$90,094 (Long-term trend filter)
> Insight: Since the short-term MA(7) is below the MA(25) and MA(99), the "Death Cross" dynamics are in play, suggesting that the path of least resistance is currently downward.
>
2. Price Action & Support/Resistance
* Immediate Support: $85,146 (recent wick low). If this breaks, the next major psychological and technical floor is at $84,000, followed by a "capitulation zone" near $80,000.
* Immediate Resistance: $87,750 (confluence of MA(25)).
* Major Resistance: $90,000 - $90,900. A 4h candle close above this level is required to shift the bias back to neutral/bullish.
3. Volume Trends
The volume bars at the bottom show significant red (selling) volume during the drops, while the green (buying) recovery wicks are relatively thin. This indicates that sellers are still in control and buyers are hesitant to step in aggressively at these levels.
The Next Move: Prediction
Scenario A: Bearish Continuation (65% Probability)
The price is likely to retest the $85,146 support level within the next 12–24 hours. If selling pressure persists and we see a 4h candle close below $85,000, expect a swift move toward the $82,000 – $80,000 range as stop-losses are triggered.
Scenario B: Consolidation/Relief Rally (35% Probability)
If the $85,000 level holds, we may see a "dead cat bounce" or a relief rally back toward the $87,700 area (MA-25). However, without a significant surge in buying volume, this would likely be a "lower high" before another leg down.
Strategic Recommendation
* For Bulls: Wait for a confirmed reversal pattern (like a Double Bottom) or a breakout above the $90,000 resistance before entering long positions.
* For Bears: The current trend favors short-term "Sell on Strength" near the $87,700 resistance, targeting the $84k-$80k levels.