The price of Bitcoin temporarily rose to around $90,000 earlier today, but the movement was short-lived.
The new liquidation data shows that the rise was less of a genuine breakout attempt and more akin to liquidity hunting. The price of Bitcoin was touching a dense cluster of short position liquidation levels before sharply reversing.
### Bitcoin hits a liquidation wall at 90,000 dollars
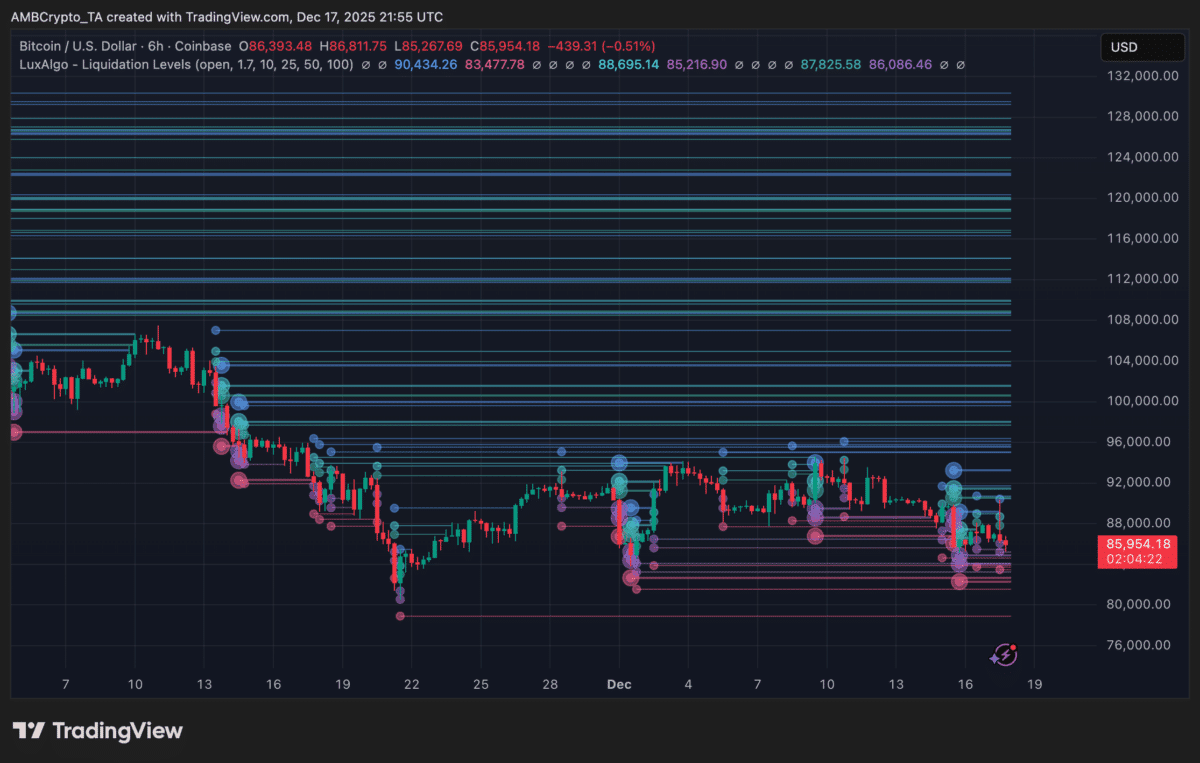
The liquidation map data shows a significant concentration of short liquidations between 89,500 and 90,500 dollars. This level formed one of the strongest pockets of resistance on the chart.
Once the Bitcoin price reached this area, the market saw a wave of forced buying from short positions — but there was no continuity.
This aligns with the typical behavior of liquidity hunting, where the price reaches a level just to fill orders and then reverses once liquidity is consumed.
The 6-hour timeframe chart confirms this: a large accumulation of short liquidation bubbles was activated around 90,000 dollars, followed by immediate selling pressure, pushing the Bitcoin price back below 87,000 dollars.
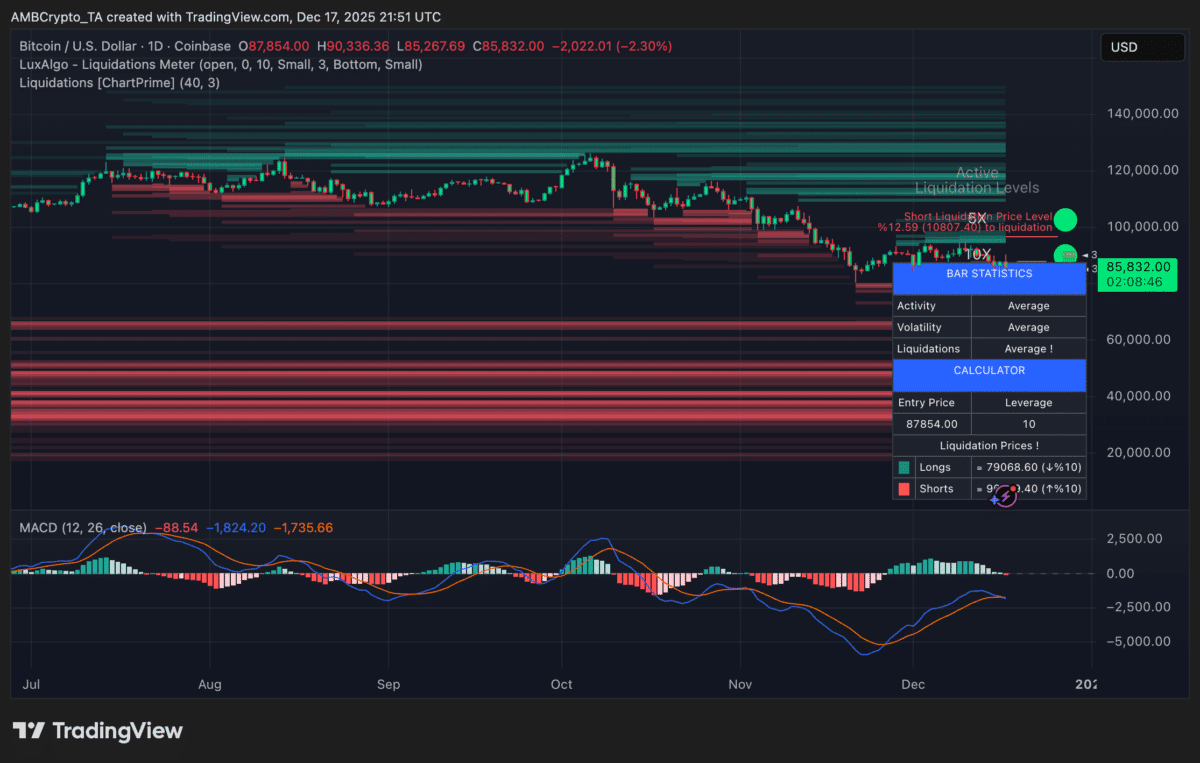
### The daily chart shows a decline in momentum and increased liquidity towards the downside
On the daily liquidation map, most high-density liquidity lies below the current price:
- 84,000 – 82,000 dollars: A major accumulation for liquidating long positions.
- 80,000 – 78,000 dollars: The next deep liquidity pocket.
- High-volume short accumulations are scarce above 90,000 dollars.
This imbalance indicates that market makers and large players may find a greater incentive to push the Bitcoin price down towards deeper liquidity, where liquidations are more profitable.
The MACD indicator also shows that momentum has weakened for over a week, with MACD lines firmly remaining below zero.
### Why did the Bitcoin price breakout fail?
Three potential factors contributed to the rejection:
Liquidity exhaustion: Once the short liquidation range at 90,000 dollars was cleared, there were no additional liquidity accumulations above it to sustain the continuous movement.
Over-leveraged long positions: The daily chart shows accumulated long liquidation levels below the price, increasing vulnerability to a sweep downward.
Momentum Divergence: The MACD shows declining buying strength even before the movement.
Together, these dynamics made the rise unstable from the start.
### What to watch next
If the Bitcoin price continues to decline, the first response area around 84,000 dollars, where long liquidation accumulations begin to increase.
A break below this level could accelerate movement towards the 82,000 - 80,000 dollar pocket, which is currently the largest visible liquidity pool.
Additionally, for any meaningful bullish attempt, the Bitcoin price needs to reclaim liquidity above 87,500 dollars and must maintain momentum above 90,000 dollars, as it needs to build new short interest again.
### Final thoughts
- The Bitcoin touch at the 90,000 dollar level was a liquidity hunt, not a sustainable breakout.
- The largest liquidation accumulations are now below the price, increasing the risk of expansion downward.
