BTC/ETH has experienced a stepwise decline and is now oscillating near a critical position. The current market presents a complex pattern where 'macroeconomic uncertainty' coexists with 'on-chain structural positive signals.' This article will analyze the real stage of the current market based on reliable on-chain data, derivative market structure, and key technical levels.
1. Macro and Market Structure: Certainty Signals Amid Uncertainty
The current market lacks a single macro-dominant narrative, and the ambiguity of the Federal Reserve's policy path has led the market to generally believe that the probability of interest rates remaining unchanged in January 26 is 77%, which continues to suppress risk assets. However, beyond the superficial price fluctuations, some deep and reliable data signals are worth paying attention to: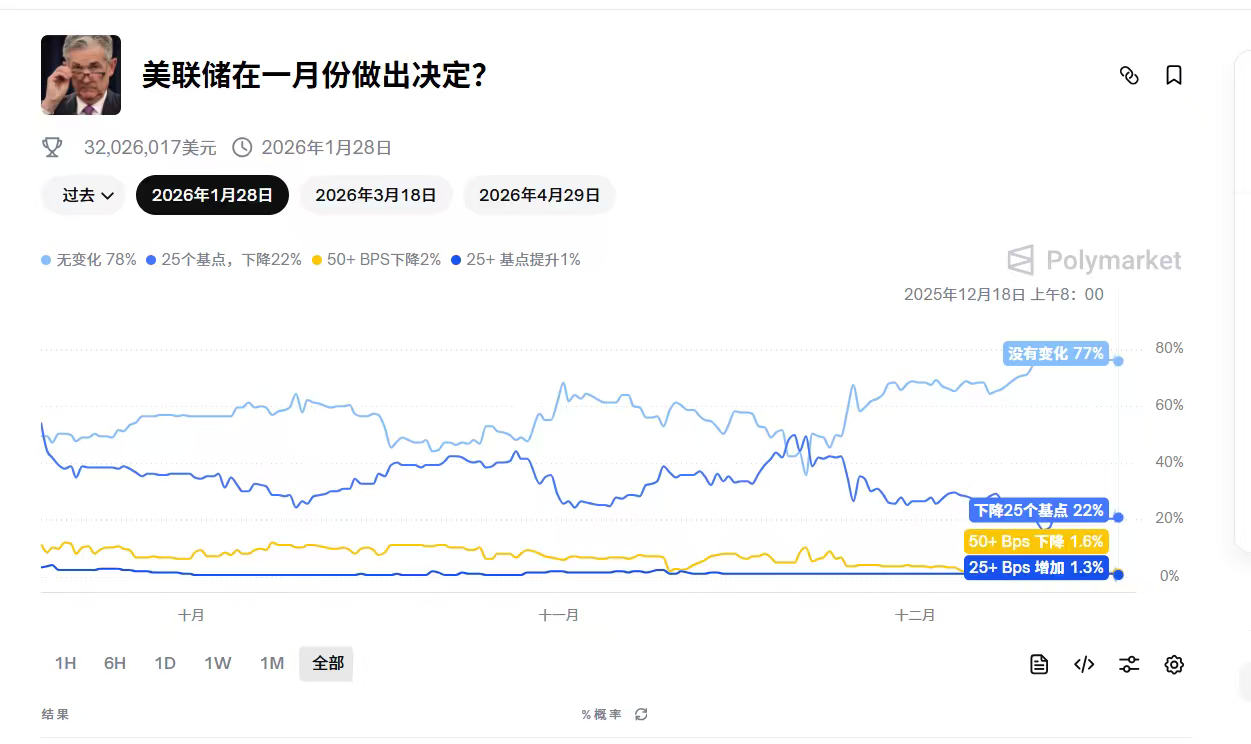
1. On-chain data: Long-term holders continue to sell.
The supply of long-term holders (LTH) of Bitcoin has fallen to its lowest level since October 2021. This means that the LTH Supply orange line is clearly trending downwards, indicating that the number of Bitcoins held long-term is decreasing, showing that long-term holders have been selling Bitcoin during this period, while short-term holders are continuously buying, which can usually be understood as large institutions selling and retail investors continuously buying!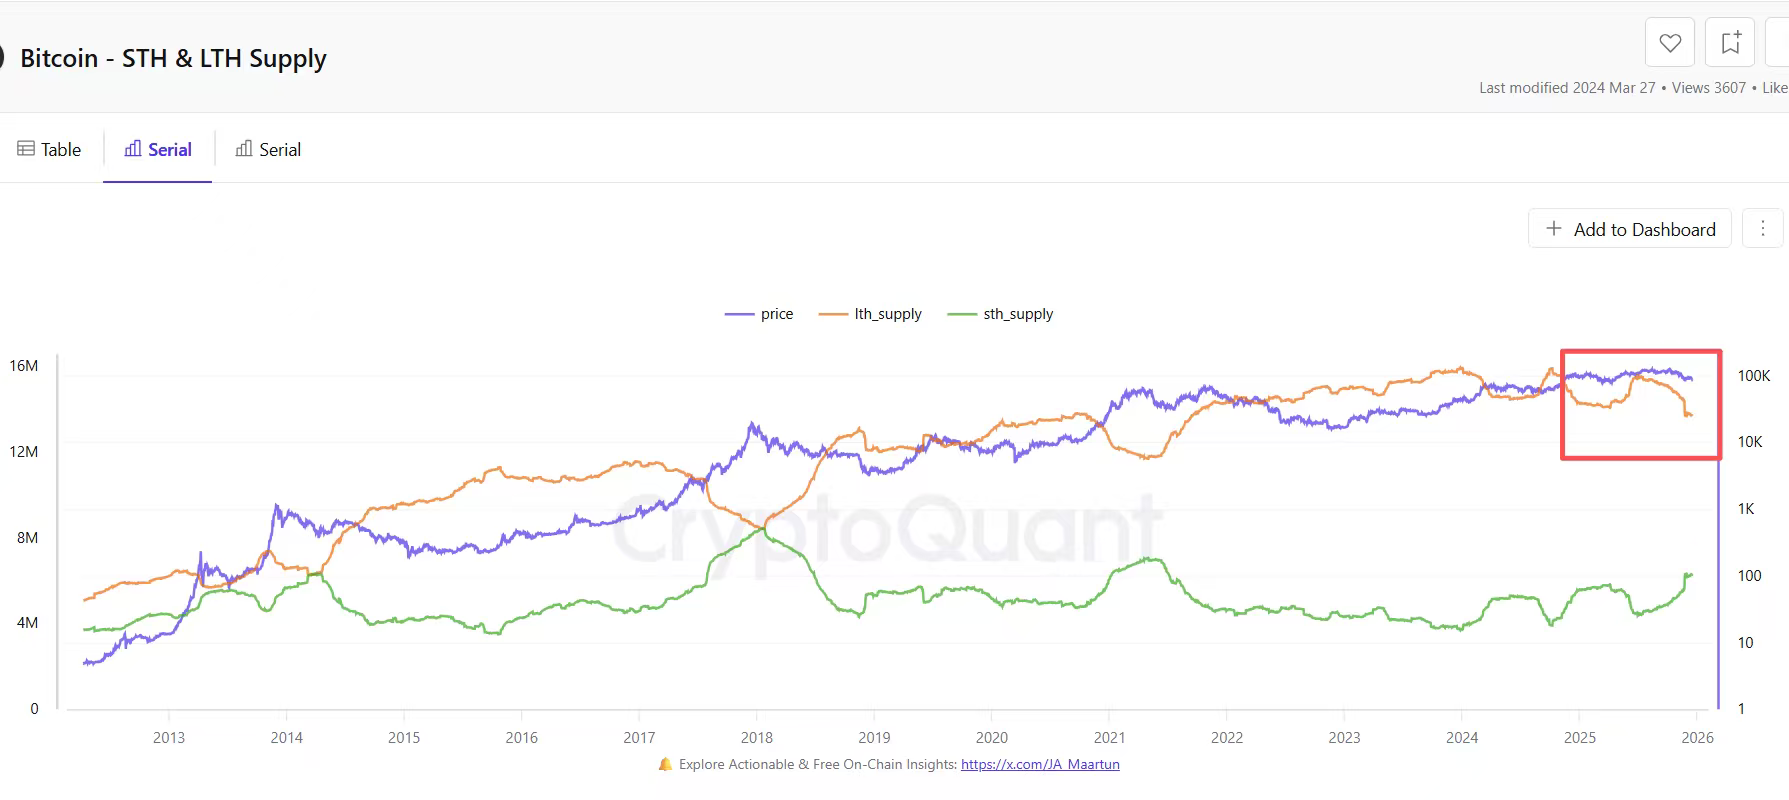
2. Institutional activities:
Yesterday, the ETF saw a net inflow of 346 million during the sharp decline, mainly due to an inflow of 392 million into FBTC by Fidelity.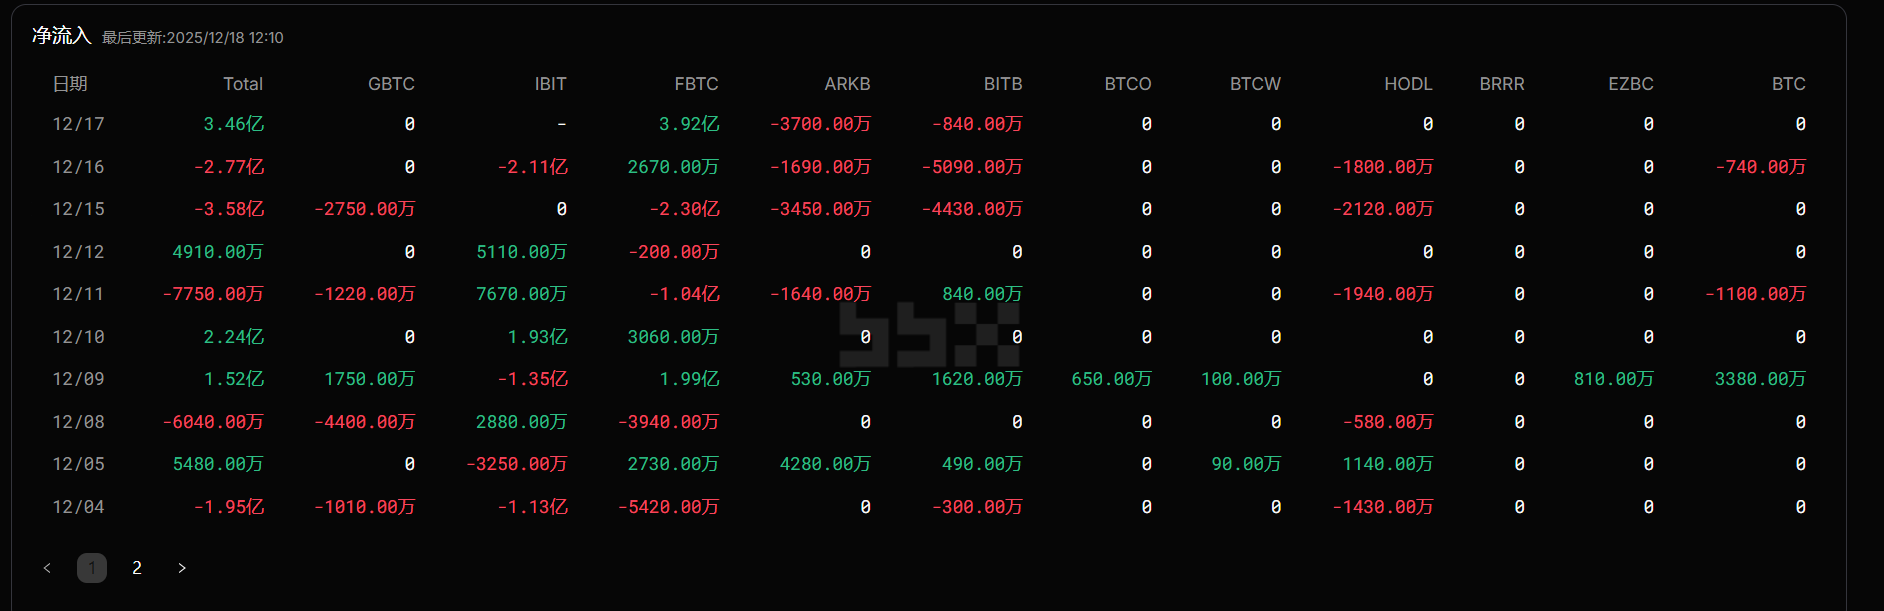
3. The Bank of Japan announced an increase in the policy interest rate by 25 basis points, from 0.5% to 0.75%, expected around 10 AM to 2 PM tomorrow. This is the 4th rate hike since the Bank of Japan ended its negative interest rate policy in March 2024, and the market generally interprets this as a key signal for accelerating the normalization of monetary policy.
Market impact logic:
Global liquidity tightening: Japan, as the last major economy to farewell to ultra-loose policies, its continued rate hikes signify that the important source of low-cost global funds is drying up, exacerbating the tightening trend in the global financial environment. Arbitrage trading reversal: This move will significantly increase the costs of yen carry trades, forcing previously borrowed yen to invest in global high-risk, high-return assets (including cryptocurrencies) to accelerate liquidation and return, directly putting selling pressure on risk assets. Psychological impact: During an already fragile market period, this move reinforces expectations that 'global central banks are still combating inflation, and liquidity will continue to tighten,' which undermines market confidence.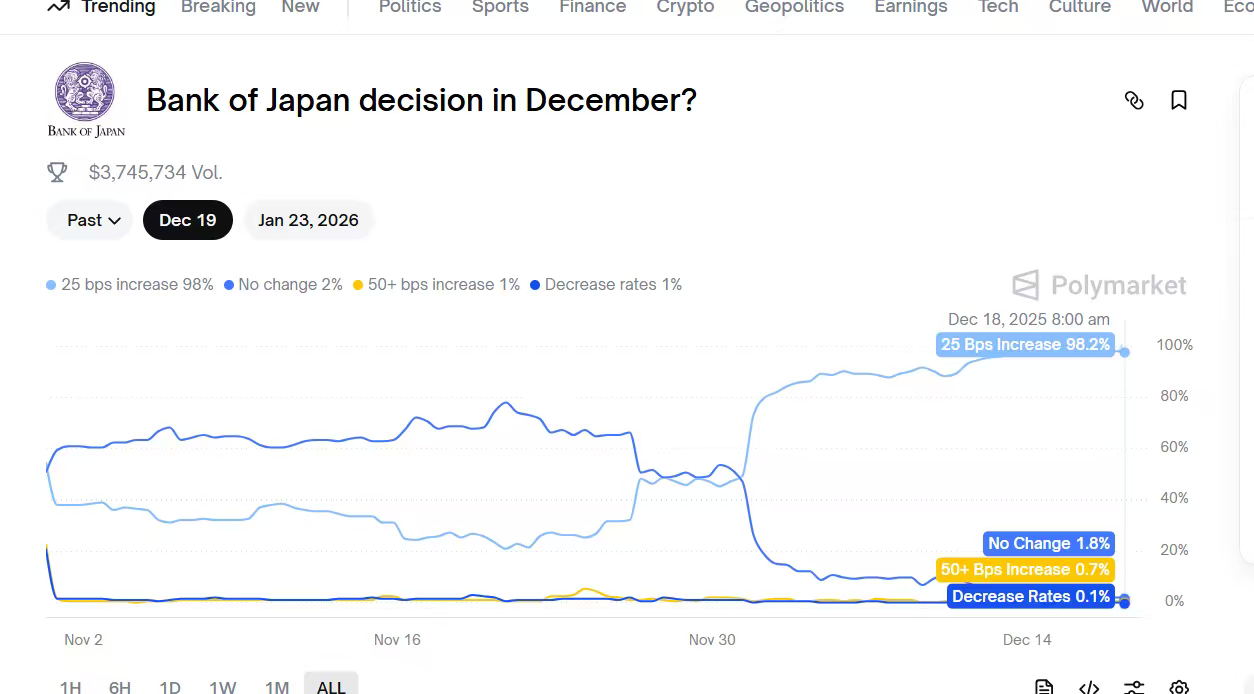
2. Technical analysis: Key support and resistance levels.
Yesterday$BTC After hitting the 90,000 mark, it did not stabilize, followed by a rapid decline, reaching a low of around 85,300, close to the previous low of around 85,000, which also serves as significant support from the Fibonacci extension line around 138. Later, we need to monitor whether it can effectively break below this level; if it breaks with volume, it will test supports at 838, 82,000, and 80,000. The upper side near 87,200 is constrained by the four-hour Bollinger middle track, around 87,800 is constrained by the Ichimoku baseline, and around 88,500 is constrained by the Fibonacci 0.618. This is an important resistance that switched from previous support after the 90,000 mark. From the chart below, it can be clearly seen that the chart has already broken the bearish flag bottom, with resistance roughly around 89,500.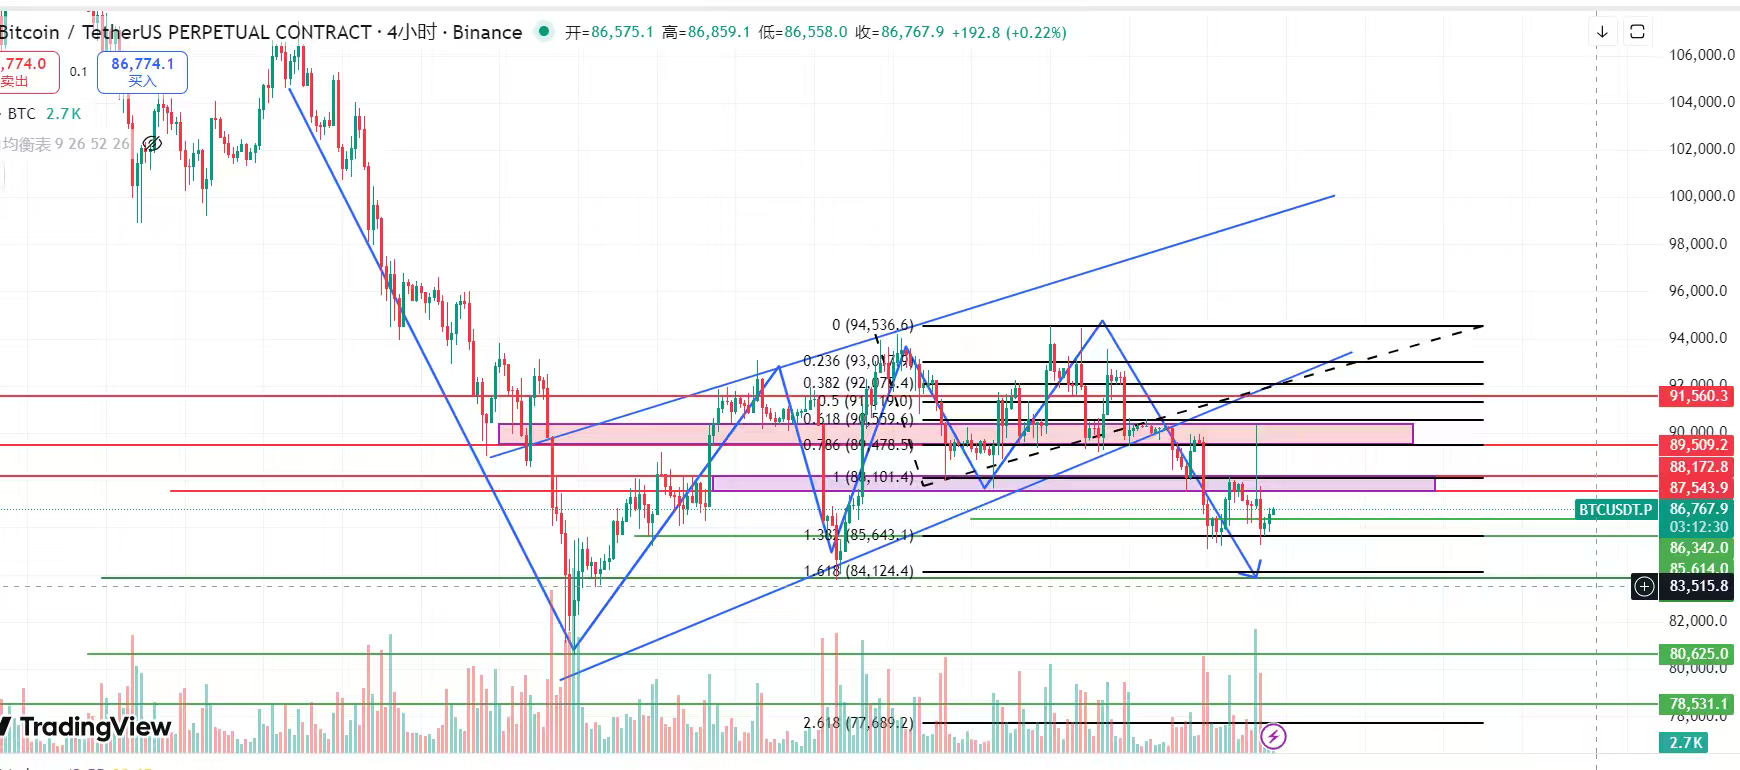
Based on the above suggestions, the main strategy is to aim for high shorts. Although the support below is relatively strong, it is still not advisable to recklessly bottom fish during critical periods.
Engage in high shorts around the rebound of Bitcoin at 87,800–88,500–89,500, targeting 86,200–85,600–83,800 (reducing positions by 80%)–80,600–78,500–70,800. The stop-loss needs to be placed above 90,500; those who cannot accept wide stop-loss should lower their position size!
For Ethereum, after our average price at 2990 near the 3030 level yesterday, it also reached a low of around 2788. Those who need to reduce their positions should do so, and continue to lay out high shorts during the day. Currently, the previous support around 2840 has become a small resistance, with resistance above at around 2915, 2960, and 3030–3060. The chart clearly shows that a head and shoulders top has formed, with resistance at the neckline around 3000–3060. Everyone can refer to these positions to lay out short positions.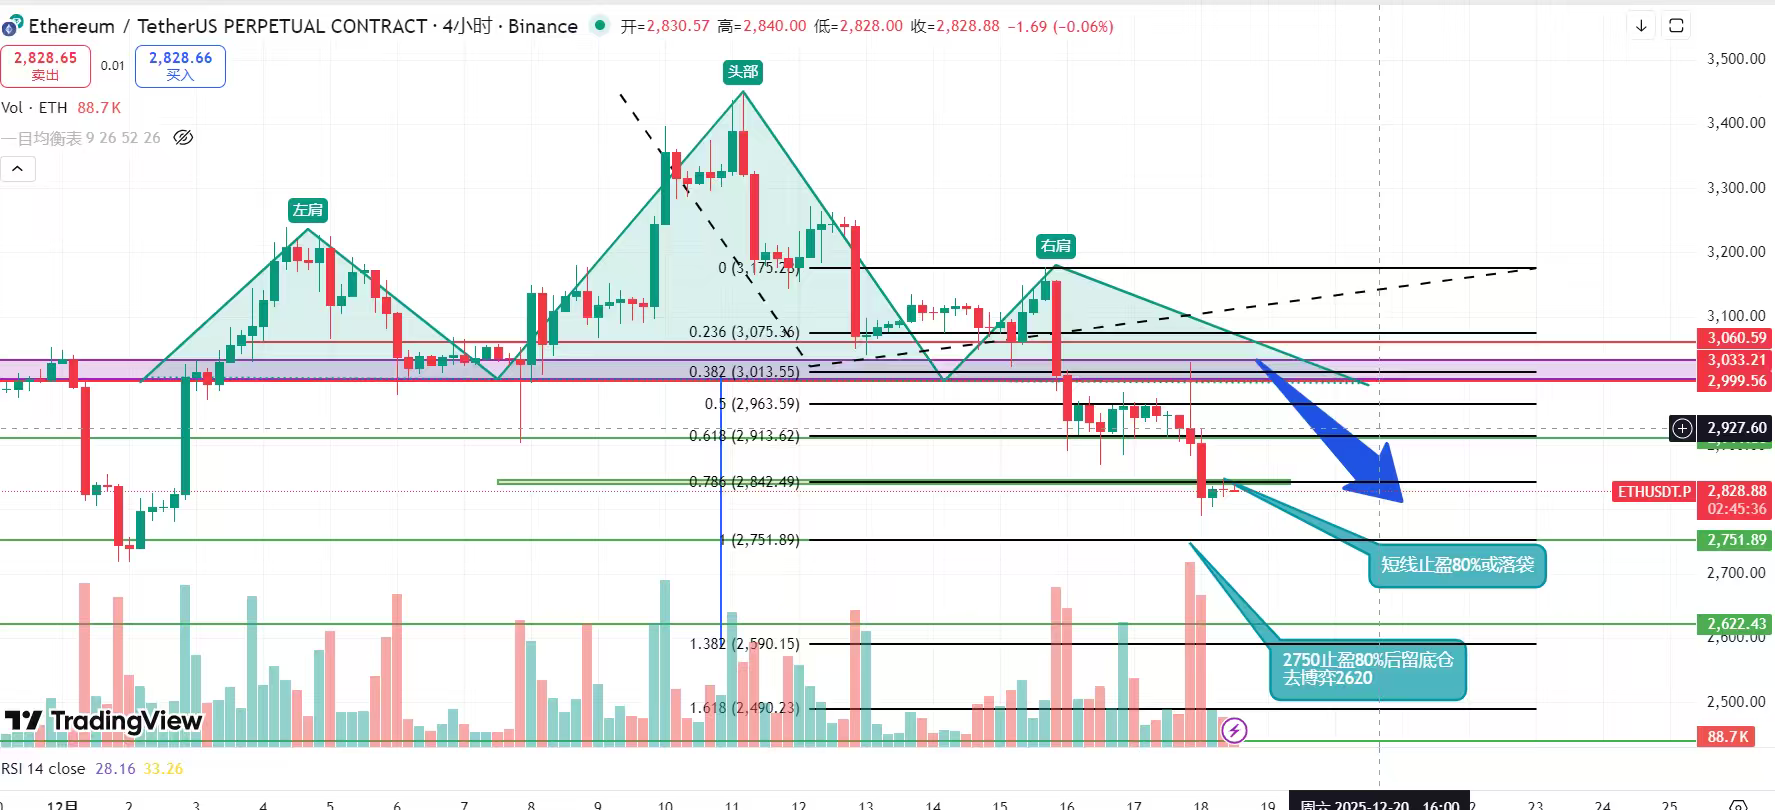
The detailed strategy is as follows:
$ETH Enter short positions in batches around the rebound of 2915–2960–3030–3060, with targets focusing on 2840–2790–2750 (reducing positions by 80%)–2620–2440, and stop-loss needs to be placed above 3090. Those unable to accept wide stop-loss should lower their position size.
The most fearful stage of the market may be passing, but rebuilding confidence takes time. This is not a time for blind optimism or extreme pessimism, but a stage based on reliable data, patiently observing, cautiously operating, and waiting for key price signals to confirm. Before the arrival of a genuine trend opportunity, preserving strength and surviving is the cornerstone of all strategies.
The above conclusions are based solely on Jiang Feng's personal insights derived from publicly available market data, and everyone must treat this rationally; profits and losses are the responsibility of the individual! Those who need a rebate can fill in the invitation code: BTC20242, which can waive transaction fees!
Written by: Jiang Feng Capital

