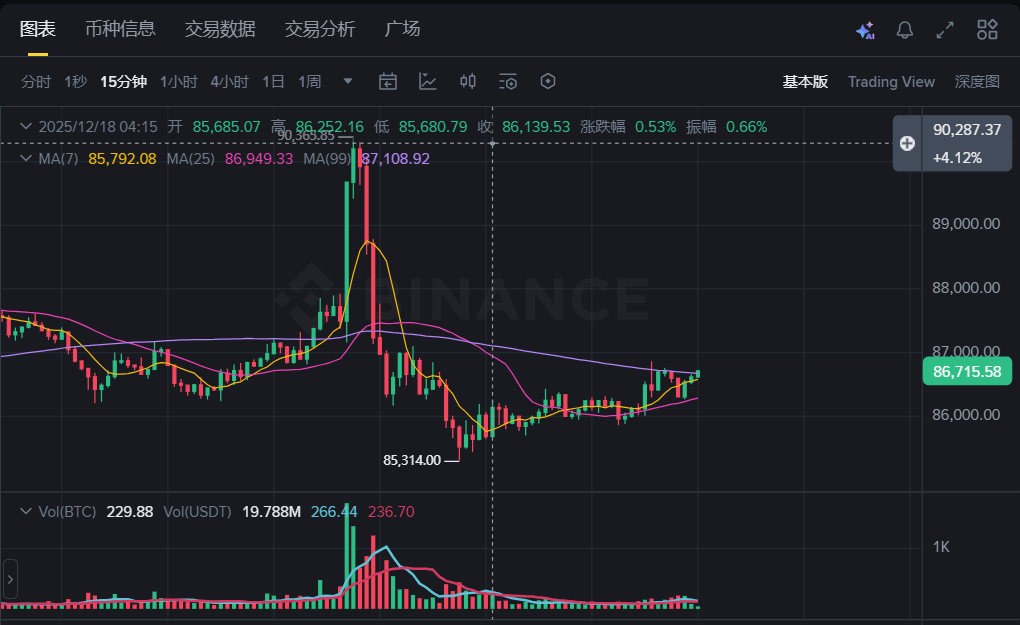
If only looking at the K-line, this segment looks like a 'sudden plunge'.
But combined with yesterday's monitoring, it is actually a very clean structural execution.
Yesterday's post monitoring room 👇
1. Conclusion first (Key point)
👉 90323 The frontline belongs to a clear short pressure area
👉 After the price reached, there was no volume breakthrough, nor was there any sideways trading
👉 The main force chooses to directly smash the market to create emotional panic
👉 The retracement target accurately lands near the accumulation area (85314)
This is not out of control, but a planned downward pressure to acquire goods.
Two, what did the monitoring tell us in advance?
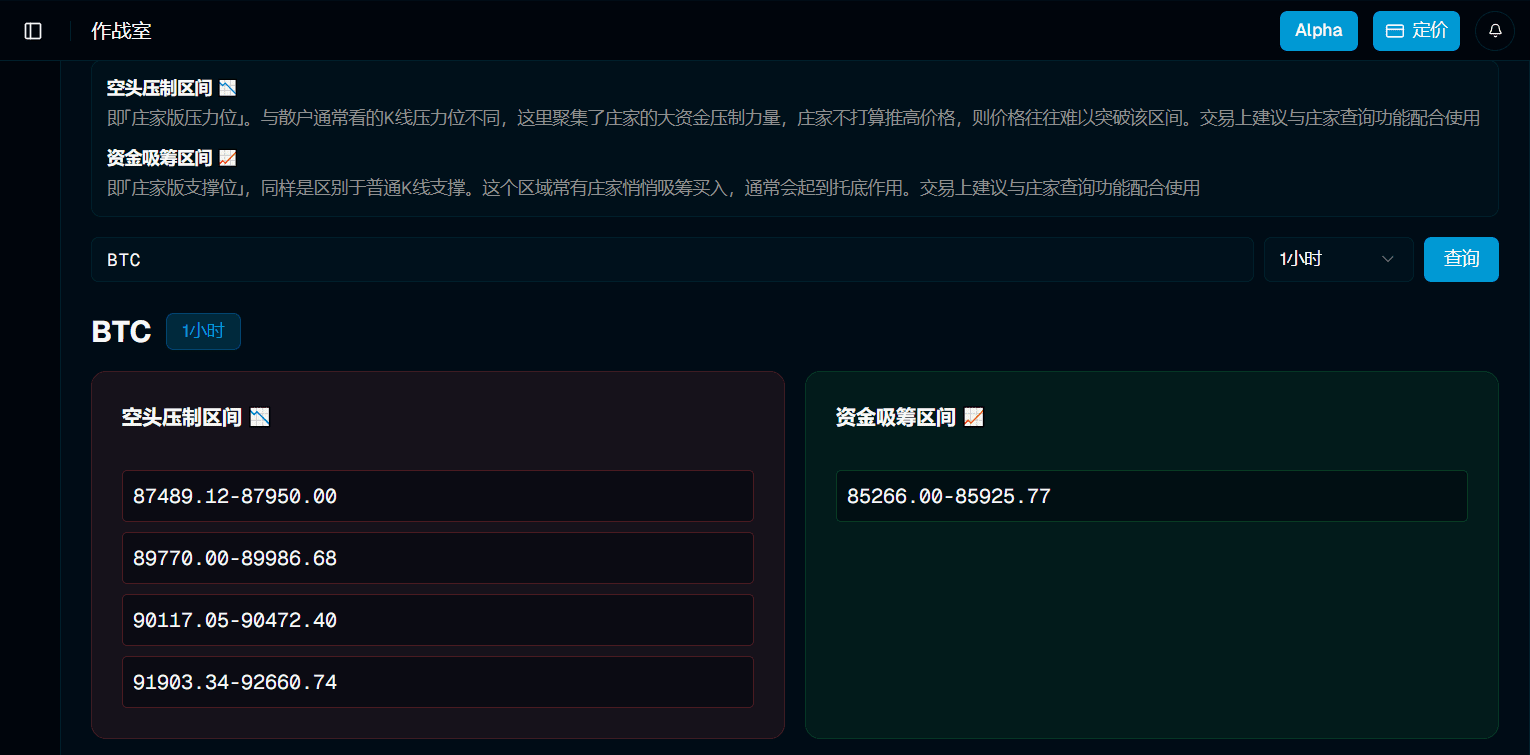
🔴 Bearish pressure zone (the position that does not allow for an increase)
The key pressure band given by monitoring is in the 90117 – 90472 range
Essentially, it is the decision-making area where large funds concentrate to suppress prices
Unlike ordinary K-line pressure, this represents the broker's attitude
👉 After reaching without breaking through, there are usually only two ways to go:
Sideways trading or quick drop.
🟢 Capital accumulation zone (the real landing point)
The monitored accumulation zone is in 85266 – 85925
Actual minimum 85314
Almost completed support at the lower edge of the range
👉 Drops quickly, but the support also comes quickly, a typical accumulation behavior.
Three, why is it not a trend reversal?
The criteria for judgment is very simple: position + behavior
❌ Truly turning bearish does not require such precision to return to the accumulation zone
❌ It will not 'drop immediately' at the pressure point
✅ The only reasonable explanation:
The upper side is unwilling to raise prices, the lower side must replenish positions
This is the typical process:
Pressure confirmation → Emotional sell-off → Accumulation completed
Four, the two pitfalls that retail investors are most likely to fall into
1️⃣ Chasing longs in the bearish pressure zone
2️⃣ Panic selling in the accumulation zone
What you see is a waterfall,
What the broker sees is:
👉 Are the chips in place?
Five, how to look ahead? (No recommendations)
Can the accumulation zone continue to show support?
Is there a volume exhaustion / lower shadow?
When approaching the 90,000 mark again,
👉 Has the structure changed?
Before breaking through,
Talking about target prices is meaningless,
First, look at the broker's attitude.
📌 The value of monitoring is not in predicting, but in marking out the 'danger zones' and 'safe zones' in advance
📌 Understanding the range is 10 times more important than guessing the direction

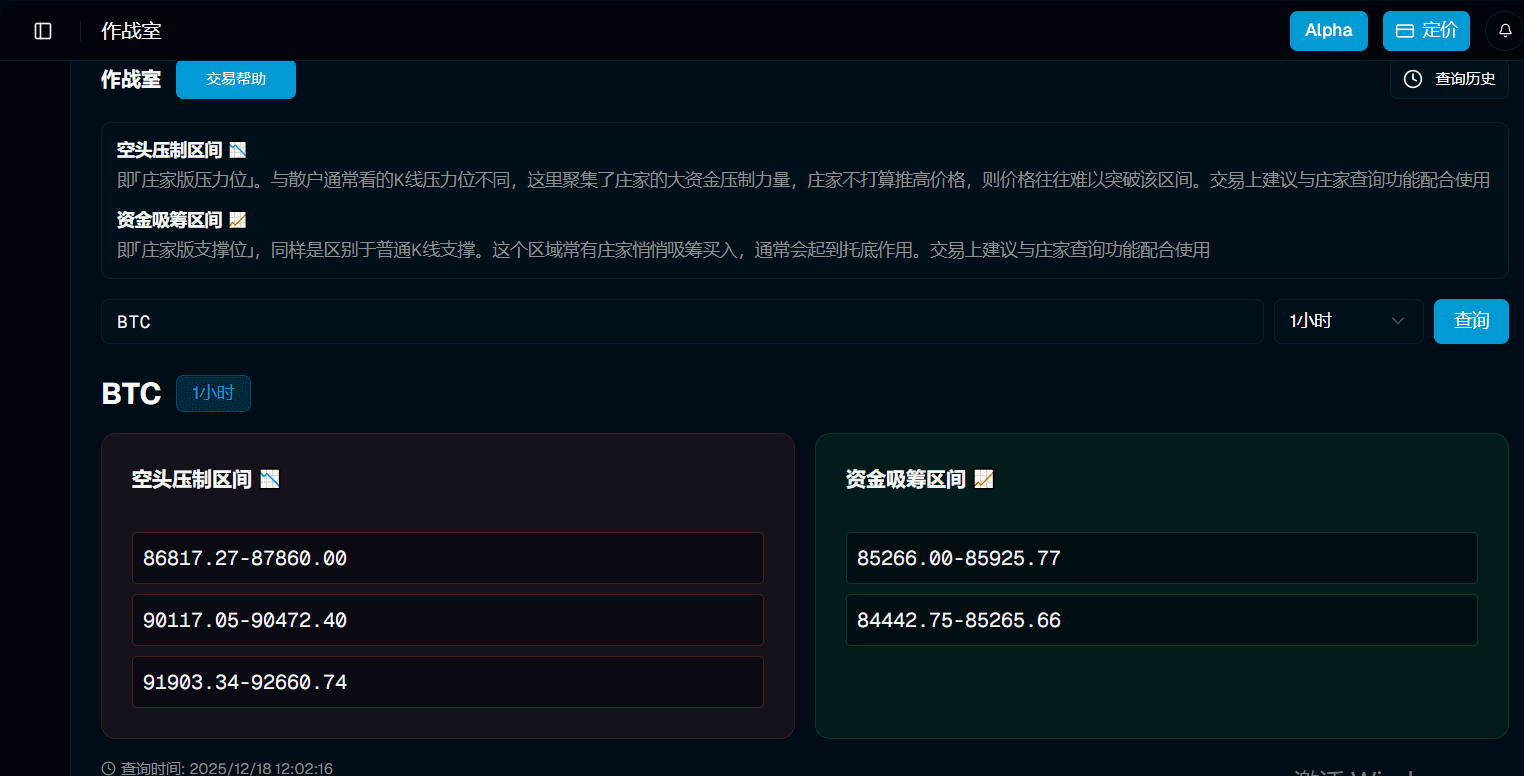
Today at 12:00, the command center monitoring 👇 Do you understand how to operate?
💥 Optimistic about bearish pressure during 86817.27-87860.00 90117.05-90472.40
During the accumulation period 85266.00-85925.77 84442.75-85265.66
Tools are not magic
The value of tools depends on the wisdom of the user.
Give you data, you need to maintain independent thinking.
This is the correct way to use it.
Not 100% accurate, but increases the probability.
- No data, blind decision-making, win rate may be 30%
- With data support, rational decision-making, win rate may be 70%
70% is not 100%, but it's already good enough.
Follow me, and I'll take you through the surface to uncover the real wealth signals.