

The ASTR/USDT daily chart is currently sending a very clear message: the market is under stress, and sellers are still in control. Over the past few weeks, ASTR has gone through a sharp and painful correction, shaking out weak hands and forcing traders to reassess the structure.
This is not just a small pullback — it’s a deep reset after an aggressive move earlier in the cycle.
Let’s break down what’s really happening on the chart, without hype, and without sugarcoating the risk.
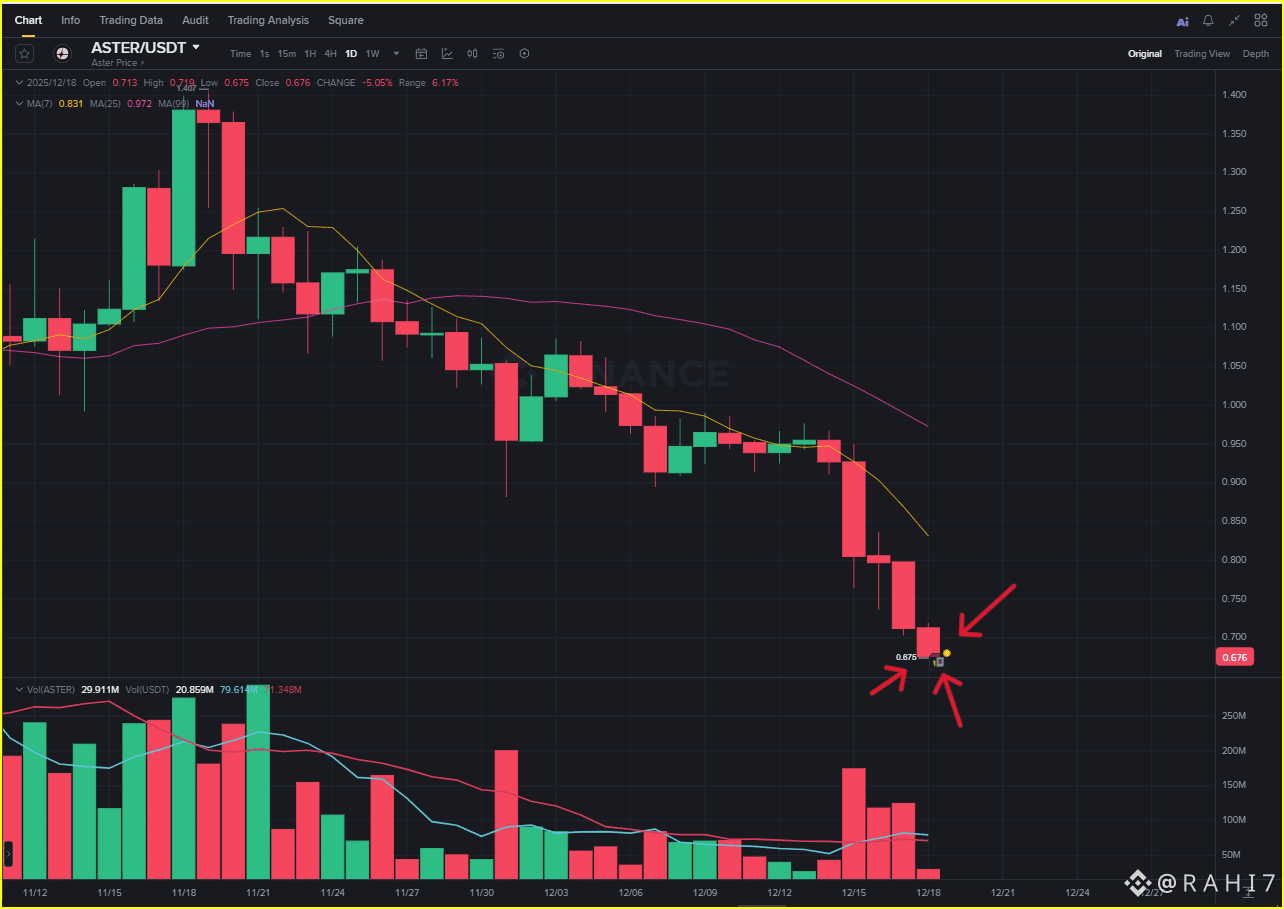
📉 From $1.40 to $0.67 — A Reality Check
ASTR previously traded near $1.40, a level that attracted heavy attention and optimism. However, that optimism quickly turned into profit-taking, and then into panic selling as the price failed to hold higher levels.
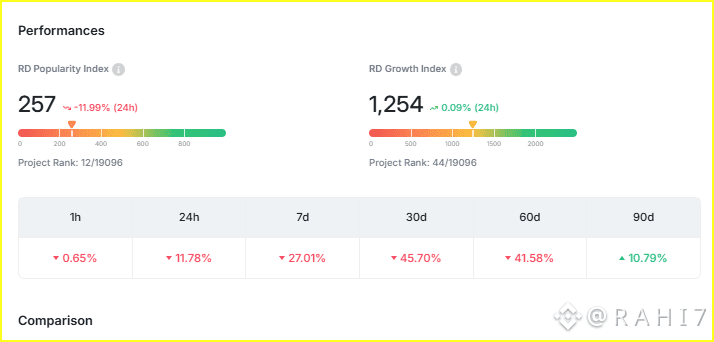
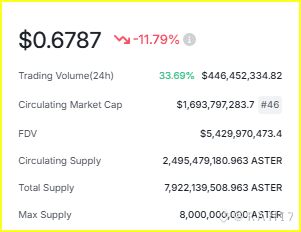
At the moment, ASTR is trading around $0.676, down roughly 5% in the last 24 hours alone. This isn’t just a random red candle — it’s part of a broader bearish structure that has been developing for some time.
The key takeaway here is simple:
Momentum has fully shifted away from buyers.
📊 Moving Averages Tell the Real Story
Moving Averages are often ignored when markets are pumping, but they become extremely important during corrections. In ASTR’s case, they paint a very bearish picture.
🔸 MA(7) — Short-Term Pressure
MA(7) is currently around $0.831
Price is trading far below this level
This tells us that even short-term momentum is weak. Any bounce attempt will likely face selling pressure as price approaches this zone.
🔸 MA(25) — Medium-Term Trend Barrier
MA(25) sits near $0.972
As long as ASTR stays below this line, the medium-term trend remains bearish
For bulls, reclaiming the MA(25) is not optional — it’s mandatory. Until then, any upside move should be treated as a relief bounce, not a trend reversal.
Right now, both of these moving averages are acting as strong resistance, not support.
🧱 Key Support and Resistance Zones
🟢 Immediate Support: $0.675
This is the most important level on the chart right now.
Price is currently sitting right on this support
A clean breakdown below this zone could open the door for further downside
If this level fails, panic selling could accelerate
This is where the market decides whether to pause… or continue bleeding.
🔴 Major Resistance Zone: $0.83 – $0.97
This range combines:
MA(7)
MA(25)
Previous structure support
For bulls to stop the damage, this entire zone must be reclaimed. Until that happens, sellers remain comfortable.
🔴 Volume Confirms Seller Control
One of the most important details on the chart is volume behavior.
Red candles are appearing with increasing volume
Selling pressure is not fading yet
Buyers are not stepping in aggressively
This confirm that the decline is not just technical — it’s supported by real market participation. In simple terms, people are still selling, not accumulating aggressively.
🧠 Market Psychology: Why This Phase Is Dangerous
This is the kind of market phase where emotions do the most damage.
Late buyers are stuck underwater
Hope bounces get sold quickly
Every small green candle feels like “the bottom” — until it isn’t
Markets usually don’t reverse when fear is still controlled.
They reverse when fear peaks and sellers are exhausted.
At the moment, exhaustion is not clearly visible yet.
🎯 What Smart Traders Are Watching Now
Instead of rushing entries, experienced traders are waiting for confirmation, such as:
A base-building structure around $0.67
A clear bullish reversal candle (Hammer, Engulfing, Strong Close)
Decreasing sell volume followed by rising buy volume
A reclaim of MA(7) with follow-through
Without these signals, entering purely on hope is risky.
📌 Possible Scenarios Ahead
🟢 Bullish Relief Scenario
If $0.675 holds and buyers step in:
Short-term bounce toward $0.83 is possible
Market may attempt to stabilize
Still a counter-trend move unless MA(25) is reclaimed
🔴 Bearish Continuation Scenario
If $0.675 breaks:
Price could search for a new lower support
Fear may increase rapidly
Capitulation becomes more likely
Both scenarios are possible — but the chart currently favors caution.
🧭 Final Thoughts
ASTR is not “dead,” but it is clearly in a dangerous phase. This is the kind of structure where patience matters more than prediction.
Right now:
Trend = Bearish
Momentum = Weak
Risk = High
Waiting for stability is not missing an opportunity —
sometimes, it’s protecting capital.
⚠️ Disclaimer
This content is for informational purposes only and reflects personal market observations.
This is not financial advice. Always do your own research (DYOR) and manage risk responsibly.