Bitcoin trades near $60,000—just below its 200-week simple moving average at $63,500—and analyst Ali charts argue that this is one of the best long-term entry windows of the past decade. He has identified the 200-week moving average as a macro accumulation zone at each major Bitcoin bottom since 2015. The pattern is consistent, the signal works, and the downside risks are defined and assessed. What history can’t tell you is timing.
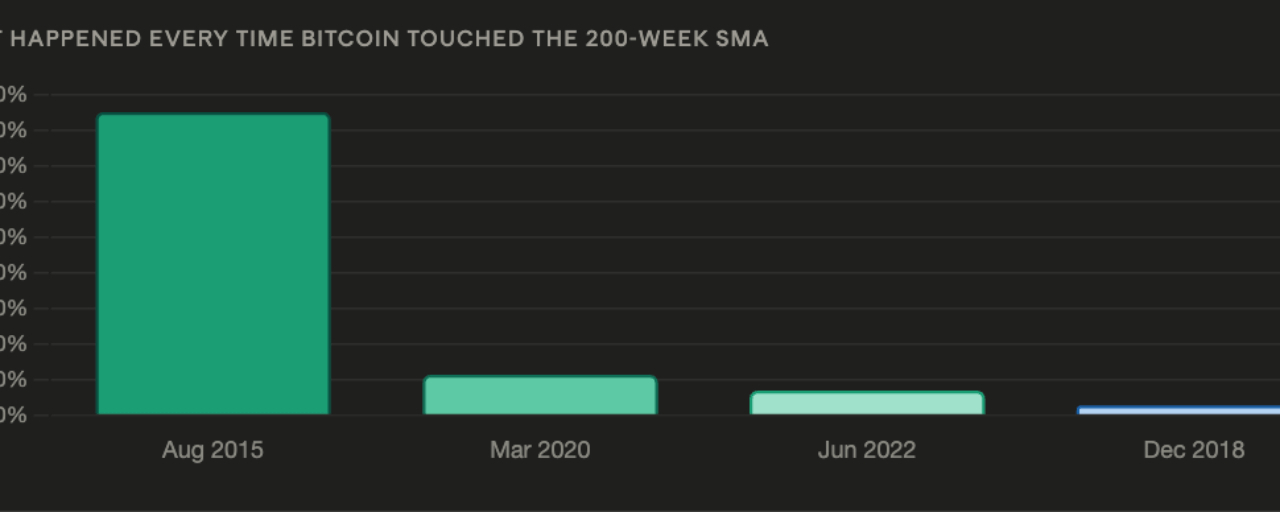
What did the 200-week moving average do at each previous bottom in the cycle
The record of the 200-week moving average acts as a cycle-bottom indicator across four different down phases within ten years. In August 2015, Bitcoin touched the moving average and a bull cycle began, producing cumulative gains that exceeded 8,500%. In December 2018, it tested the level and rebounded by roughly 267%. In March 2020, the liquidity shock tied to the pandemic pushed Bitcoin slightly below the moving average for a short period before confirming support and rising 1,125% from that level. In June 2022, Bitcoin broke the moving average for the first time in its history—and remained below it for six months until December 2022, when it reclaimed the level and launched an upmove of about 680%.
The current setup matches this historical pattern almost precisely. The 200-week SMA is around $63,500. Bitcoin is trading near $60,000—below this level, in the area that has historically represented the deepest available discount for long-term investors across the entire institutional maturation cycle of Bitcoin.
Why is it described as a macro-level accumulation window
Ali Charts’ specific framing: each time Bitcoin touched or broke below the 200-week SMA, it was opening what the analyst described as a "macro accumulation window"—a period in which long-term investors who built positions at or below the moving average historically were rewarded with the full upside of the next bull cycle. Returns from those windows—8,500%, 267%, 1,125%, and 680%—vary widely depending on entry timing and exit discipline, but none of them produced losses for investors who held through the subsequent cycle.
The level of $63,500 is described as the "line in the sand between the bull and the bear." A decisive reclaim of the 200-week SMA on a higher timeframe—by breaking the price above $63,500 and confirming it as macro support through consecutive weekly closes—has historically signaled the early stages of a new bull cycle rather than the continuation of a bear market.
Warning: Downside risks at $54,000 and $40,000 are still on the table
The historical pattern is not a timing guarantee, and Ali Charts explicitly maps out the remaining downside risk before any confirmation signal arrives. A drop to $54,000 is noted as possible in the near term—about 10% below current prices—and near Bitcoin’s realized price of roughly $53,600, a level CryptoQuant identified as the threshold where the asset-holder average shifts from profit to loss. In extreme scenarios, a test of the $40,000 range cannot be ruled out—an additional 33% drop that could represent a move far below the realized-price boundary of any prior cycle.
This range of outcomes—from an immediate rebound toward $63,500 to the possibility of extending to $40,000—is why the proposed approach is a staged Dollar-Cost Averaging (DCA) strategy to build positions gradually between $58,000 and $40,000. Allocating a fixed amount at regular intervals within this range lets investors build positions at technical-discount levels without needing precise timing for the exact moment the bottom forms. It’s the most consistent strategy with the historical observation that accumulation windows can be identified even when the bottom can’t be pinpointed precisely.
How does that fit with the broader bottom-signal buildup in June
Ali Charts’ analysis of the 200-week SMA adds to one of the densest clusters of synchronized bottom indicators that Bitcoin has produced in this cycle. CryptoQuant’s cycle momentum index reached -30—historical bottom territory. The Sharpe ratio was -20 on June 11, matching the level seen at the lows of 2015 and 2018–2019 and 2022–2023. RHODL’s ratio is falling from its peak in the pattern that preceded the 2015 and 2022 recoveries. Long-term holders dominate with a record 79% of the circulating supply. Glassnode’s accumulation trend score hit its highest reading of 1.0 for weeks. Additionally, 259,000 Bitcoins were added net between $59,000 and $67,000 since June 5.
The consistent message across every indicator is the same one Ali Charts concluded:
There are the structural conditions needed to reach a bottom. Confirming that the bottom has been reached and that the next upward cycle has started requires Bitcoin to reclaim $63,500 and hold it as support—an exam it hasn’t passed yet. Moreover, this week’s fresh breakdown coincides with a ceasefire truce between the United States and Iran, alongside six consecutive weeks of outflows from ETF funds, and Reuters’ survey consensus that the Federal Reserve will not cut interest rates until 2027, making it harder to achieve in the near term.
#binancenew #BTC70K✈️ #Squar2earn #newscrypto
