
AJ is staring at the winding candlestick chart of ETH on the screen, feeling as if his brain cells are about to twist into a helix.
"Is this the darkness before dawn, or the... more dusk after dusk?" he murmured to himself, feeling that his investment mood was more volatile than the fluctuations of this candlestick chart.
As a newcomer who has just entered the circle for three months, he jumps back and forth every day between the "sense of a surge" and "anxiety about a crash." Yesterday, he heard Zhang San say "good news is coming soon," and today he saw Li Si analyze "the support has been broken," AJ felt like he was not trading but participating in a large metaphysics seminar.
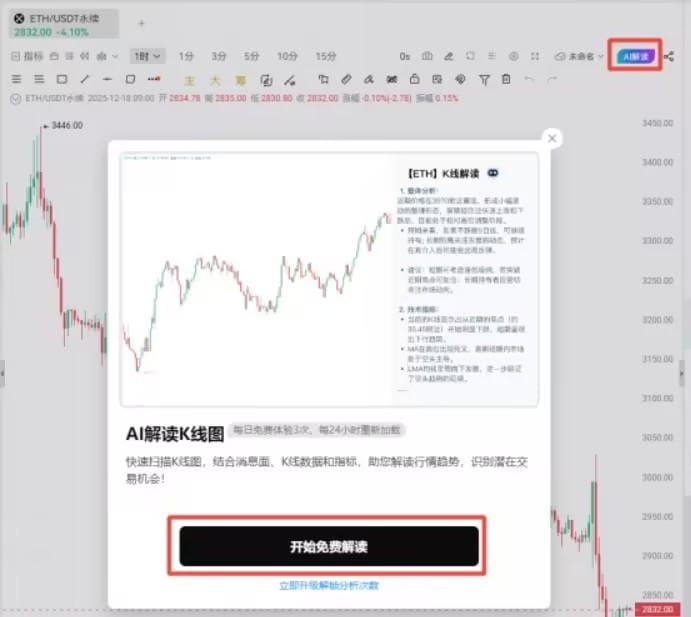
Until a Wednesday afternoon when the market was stable and the group was unusually quiet. AJ opened the trading software for the Nth time, staring blankly at the ETH which had been stuck in a range for a long time, his fingers unconsciously sliding on the screen. Suddenly, a small icon in the corner of the interface, which was not very conspicuous but was glimmering slightly, caught his attention - 'AI Interpretation of K-line'.
“Oh? Can AI see this too? Let AI take a look?” he mumbled, with a curiosity that carried a sense of 'there's really no loss', clicking it open.
The interface was clean and simple, prompting him to upload or select the K-line chart he wanted to analyze. AJ chose the 1-hour chart of ETH and clicked 'Start Analysis'.
What happens next surprised him a bit.
On the screen, a complicated and hard-to-understand list of terms did not pop up immediately, but a gentle loading animation appeared, as if AI was 'observing' and 'thinking'. A few seconds later, a clearly structured report unfolded like a scroll, with the first sentence boldly setting the tone:
“【ETH • 1 Hour】Core Viewpoint: Currently in a downtrend.”
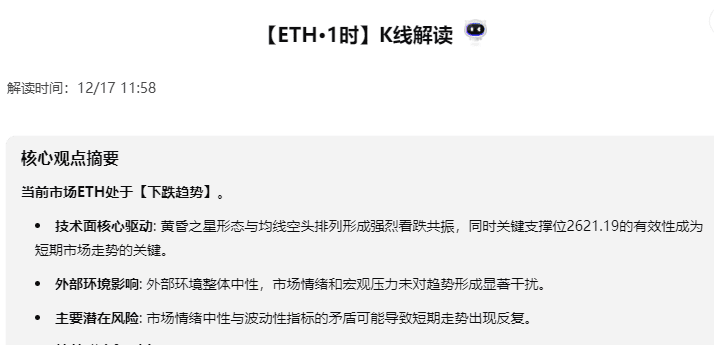
AJ's spirit lifted. This tone was calm and assertive, unlike the guesses in the group that were always couched in 'might', 'maybe', 'I feel'.
AI's analysis began; it was not a cold machine report, but rather like an experienced old trader with glasses, patiently explaining the chart stories to him under the lamp:
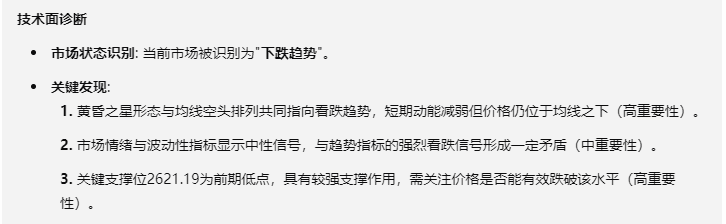
“The Evening Star... so that's what it means!” AJ slapped his thigh and quickly compared it with his chart. The three K-lines that he had previously thought looked 'a bit strange' suddenly took on a clear meaning.
AI not only interpreted the figures but also integrated market sentiment and macro environment:
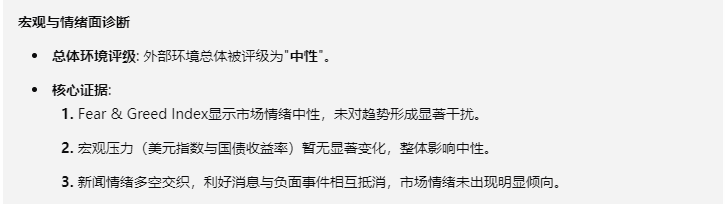 “Current external sentiment is neutral, with no major news stirring things up. So - the technicals speak for themselves.”
What AJ found most considerate was that AI also provided two clear 'action plans' and explicitly stated its 'thinking logic':
“Based on the analysis above, we provide two strategic ideas for your consideration in conjunction with your own risk tolerance:”
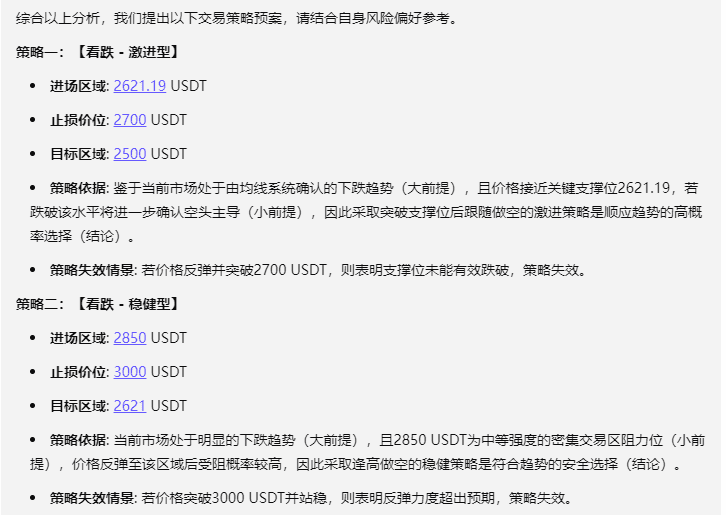
“It not only tells me 'what it thinks', but also 'why it thinks so', and even provides 'if A happens, consider B; if C happens, consider D' coping strategies.”
AJ felt an unprecedented clarity. It was different from the one-way indoctrination of any 'teacher', more like an interactive, logically deduced teaching.
He suddenly felt that the lines and numbers that were jumping before him were no longer nerve-wracking but rather a set of market languages that were logical, structured, and rhythmic. AI helped him translate this language.
Of course, AI did not forget to remind at the end solemnly:
“This content is for reference only and does not constitute any investment advice. The market has risks, and investments should be made with caution.”
Seeing this sentence, AJ felt even more at ease. It did not deify itself and clarified the boundaries of the tool.
AJ smiled as he closed the analysis page. He did not immediately or blindly place an order according to any strategy. But the anxiety in his heart caused by 'not understanding' had dissipated significantly. He now understood:
Technical analysis is not a mysterious divination, but a language for understanding the psychological and behavioral traces of market groups. A good auxiliary tool is like an excellent translator or navigator; it won't decide your destination but can help you identify landmarks more clearly, understand the map, and plan possible routes, allowing your own journey to be clearer and more composed.

From then on, whenever AJ faced the complex K-line charts, he would habitually click that function.
He knew that his calm, rational 'crypto guide' would once again unravel the threads for him, illuminating the key landmarks and forks in the road ahead.
Join our community, let's discuss and become stronger together!
Official Telegram community: t.me/aicoincn
AiCoin Chinese Twitter: https://x.com/AiCoinzh
Group Chat - Wealth Group:
https://www.aicoin.com/link/chat?cid=10013
