The recent price movements of Polkadot suggest that the market may enter a transitional phase after an extended corrective movement.
Analyses from GainMuse show that DOT is stabilizing near a long-term support area, with a clear slowdown in downward momentum as the price hovers near key technical levels.
Instead of continuing a strong decline, price behavior is now reflecting indecision from sellers and an increasing balance between supply and demand.
### Support is held after a prolonged decline
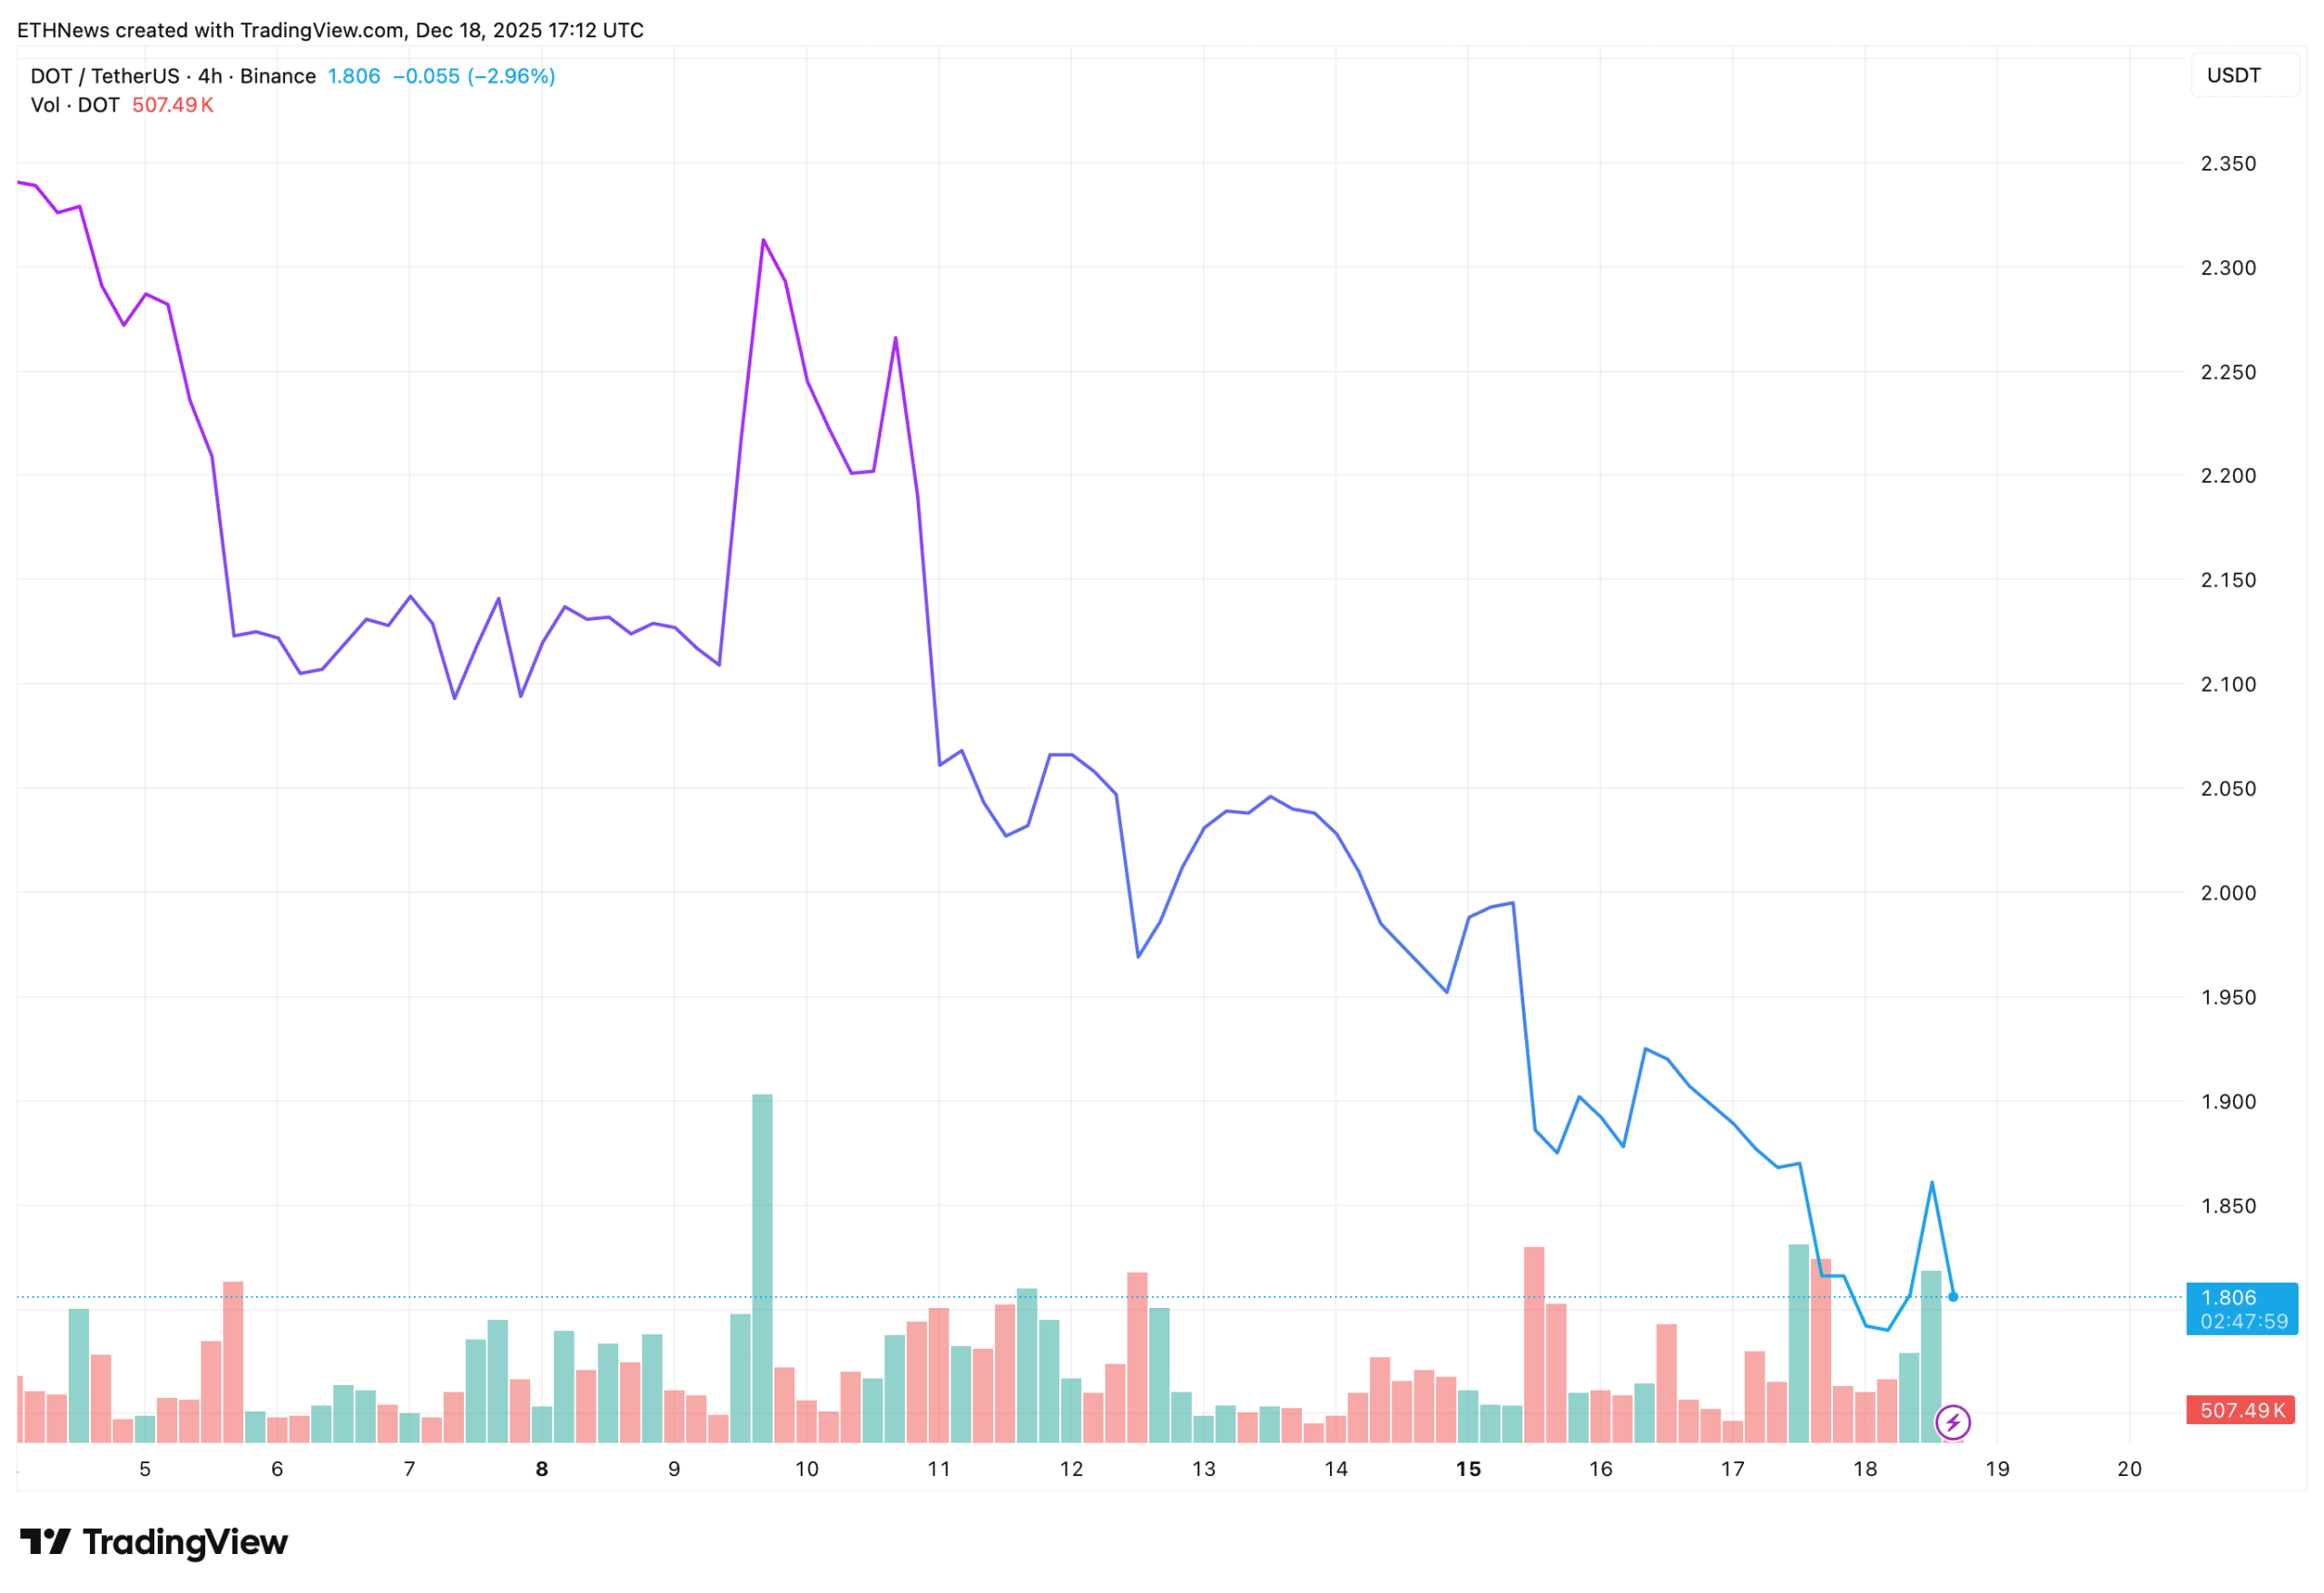
TradingView chart shows that DOT/USDT is trading around $1.80, after a steady decline from higher levels at the beginning of the month. Despite multiple attempts to push below, the price consistently reacts near the same horizontal support area, indicating that sellers are struggling to extend the move.
This stability comes after a clear downward trend, suggesting that a significant portion of the selling pressure has already been absorbed. The chart highlights a series of lower highs but with less pronounced downward follow-through near support.
### The descending structure begins to weaken
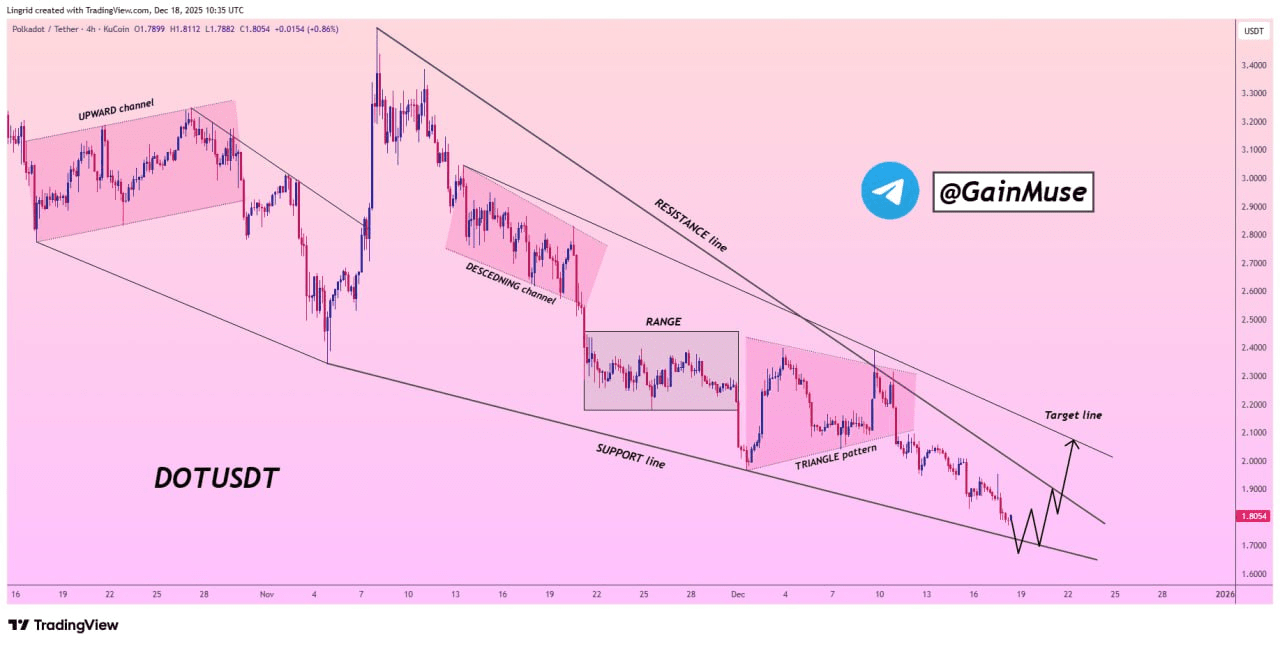
The technical overlay illustrates a broader descending structure that has driven price movement for weeks. However, recent candles are pressing near the lower boundary of this structure rather than accelerating downward.
This behavior often indicates weak bearish control. The price no longer follows the resistance trend cleanly but moves sideways within a tight range, aligning with early accumulation characteristics rather than distribution.
### Accumulation indicates a stage of gathering
Volume data supports the idea of accumulation. While there are sideways spikes, the overall activity does not show panic selling. Instead, volume appears more balanced, with buyers consistently stepping in near the same price area.
The hanging chart clearly indicates accumulation rather than aggressive selling, reinforcing the view that market participants may be positioning themselves quietly rather than exiting.
### A breakout above resistance may change momentum
The technical analysis from the higher time frame outlines a potential bullish scenario if DOT can break above the descending resistance. A sustained move outside that trend line would indicate a structural shift and open the door for a broader recovery phase.
Until then, the price remains within a range, but declining selling strength indicates that momentum is gradually shifting in favor of buyers.
