The recent decline in liquidity may be the worst signal for the market, indicating an impending bear market trend.

The market is currently in a state where large assets have broken through major support levels, which may lead to further declines. Unfortunately, there seems to be no signs of recovery in the short term, and investors must accept this reality in order to move forward.
Ethereum has lost its substance
Ethereum prices are retreating and are no longer showing a trending rise. The daily chart clearly displays the market structure: ETH failed to hold the high after the rebound, broke below important moving averages, and is currently undergoing a controlled, non-panic sell-off. This is not a signal of surrender, but rather a distribution for downward liquidation.
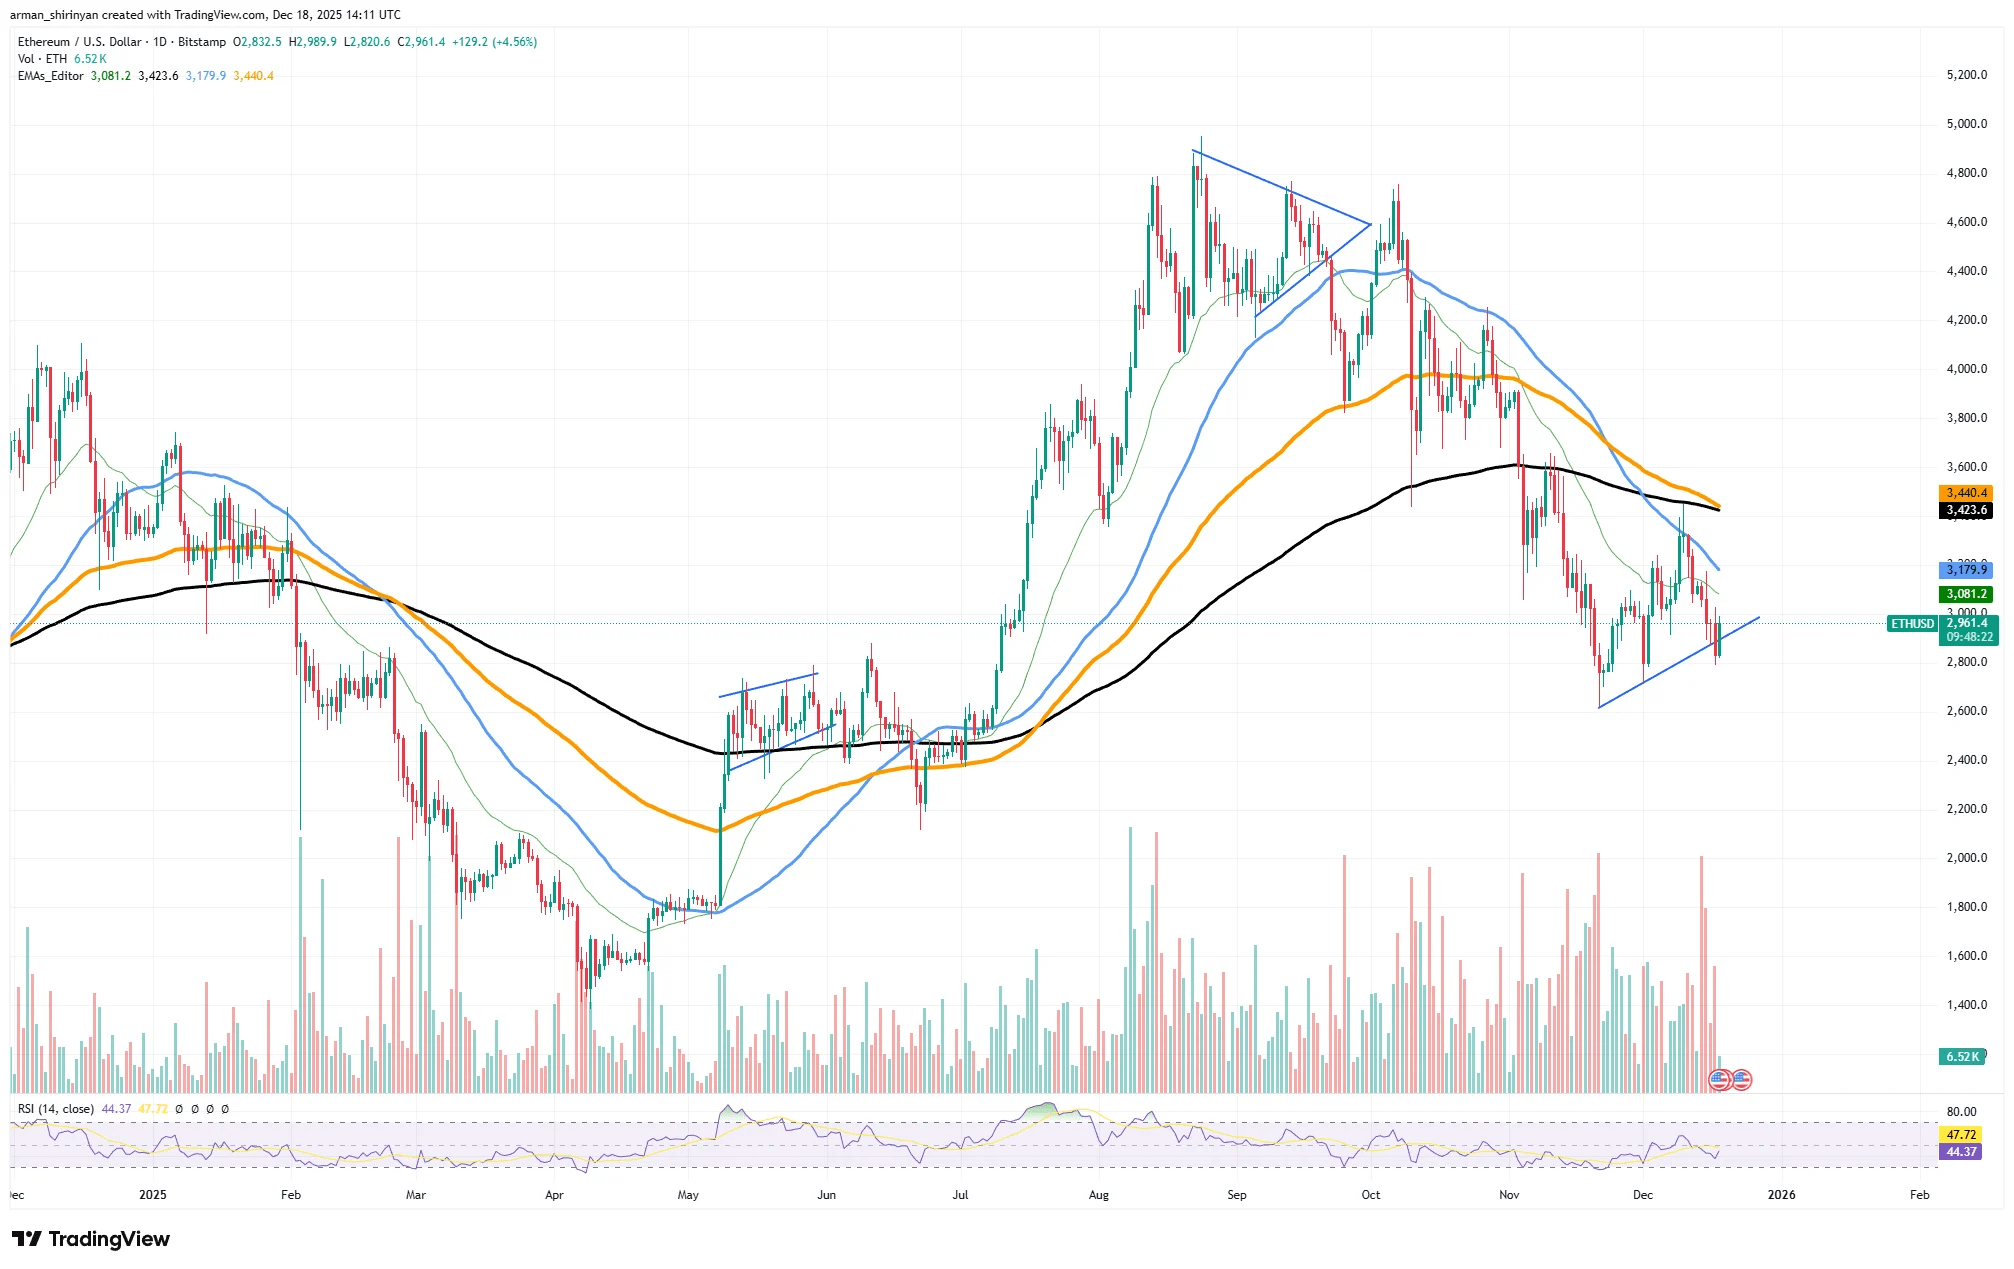
Ethereum's current performance resembles an asset that has lost control yet still retains momentum. Every rebound attempt has been swiftly sold off, and prices have dropped below short-term and medium-term moving averages. This indicates a lack of confidence among buyers to defend higher price levels, while sellers are merely relying on weak prices and are not in a hurry to act.
The trading volume also confirms this, with light volume on up days and increased volume on down days. This is not chaos, but traditional bearish pressure. There is almost no structural obstacle before $2500. Previous support levels have now turned into resistance above, and previous consolidation areas have been broken or invalidated.
Essentially, Ethereum is currently in a vacuum between an active demand area and a potential demand area. From a technical perspective, $2500 is the next area where buyers might reasonably appear. This is not because there is anything magical about this price level, but because it aligns with long-term moving averages, psychological pricing, and previous accumulation trends.
Crucially, there is almost nothing to prevent Ethereum from eventually reaching that point. There are no notable bullish divergences, no strong horizontal support, and no signs of a trend line pullback. The mid-range position of the relative strength index (RSI) also confirms that Ethereum is not yet oversold and that the market still has room to decline without triggering reflexive buying.
The XRP market is weak.
XRP has not perished, but it is indeed weak. The market has been ignoring this critical distinction. Despite the continuous price decline and still being trapped below major moving averages, XRP has not truly lost its macro bottom support. This is currently more important than most short-term indicators.
XRP's current performance is not a free-fall decline, but rather resembles an asset compressed under continuous selling pressure. Every rebound in the past few weeks has been sold off, the downtrend channel remains intact, and market momentum is clearly bearish.
However, despite this, prices remain above a previous significant demand area, where there had been substantial selling and multiple reversals. Although tested multiple times, this level has not been clearly breached. This is not strength, but adaptability. And these two are distinctly different.
The view that bearish momentum is slowing rather than accelerating is supported by the relative strength index (RSI) approaching the lower limit. Although XRP is not severely oversold, it is close to being oversold, and unless the overall market condition deteriorates, it is enough to suppress more aggressive selling. Although sellers remain active, their control is not as strong as before the crash.
Prices are likely to rebound from the current area. This is merely a pullback, not a severe reversal or change in trend. Rather than thinking about recovery, one should focus on alleviation. From a technical perspective, even without a favorable catalyst, it is reasonable for prices to retreat to short-term moving averages or local resistance levels. This is just the market's response to price levels that have not yet been breached.
Setting expectations is crucial. Even if XRP does rise, its price is unlikely to soar significantly. Trading volume is likely to remain moderate, and prices will continue to face significant resistance. But before discussing price trends, survival is the most important.
Bitcoin's structure tends to stabilize.
In Bitcoin's current structure, there is one formation that stands out: the head and shoulders pattern on the daily chart. This is precisely the most direct explanation for the price movements we have observed over the past few months; it is neither forced nor a story fabricated to appease the market.
Trend support levels have sharply declined, followed by a strong rebound, forming a breakout high (the head), and then forming two lower highs (the shoulders) that failed to regain momentum. This is a textbook pattern.
Currently, Bitcoin is not crashing but resembles an asset transitioning from a trending market to a pullback. The failure to regain key moving averages after dropping below them perfectly confirms the theory of a head and shoulders top formation. The key is that this formation has already endured most of the impact.
After the right shoulder formation, a strong wave of selling occurred, which looks like the end of a head and shoulders top formation rather than the beginning. Most people will make mistakes here. A completed head and shoulders top does not always indicate a bearish outcome. In fact, once the formation is complete and weak positions are sold off, it often creates conditions for stabilization and rebound.
The market does not continuously present trends but will reset. This pattern serves the purpose of resetting. A consolidation phase around the current level may follow, with market volatility narrowing as sellers are eager to act.
When the RSI indicator approaches the lower limit, it indicates that the bearish momentum is weakening rather than accelerating. The panic sentiment has dissipated, leaving only a large number of positions being closed. This is exactly what people expect after the structural formation fades.


