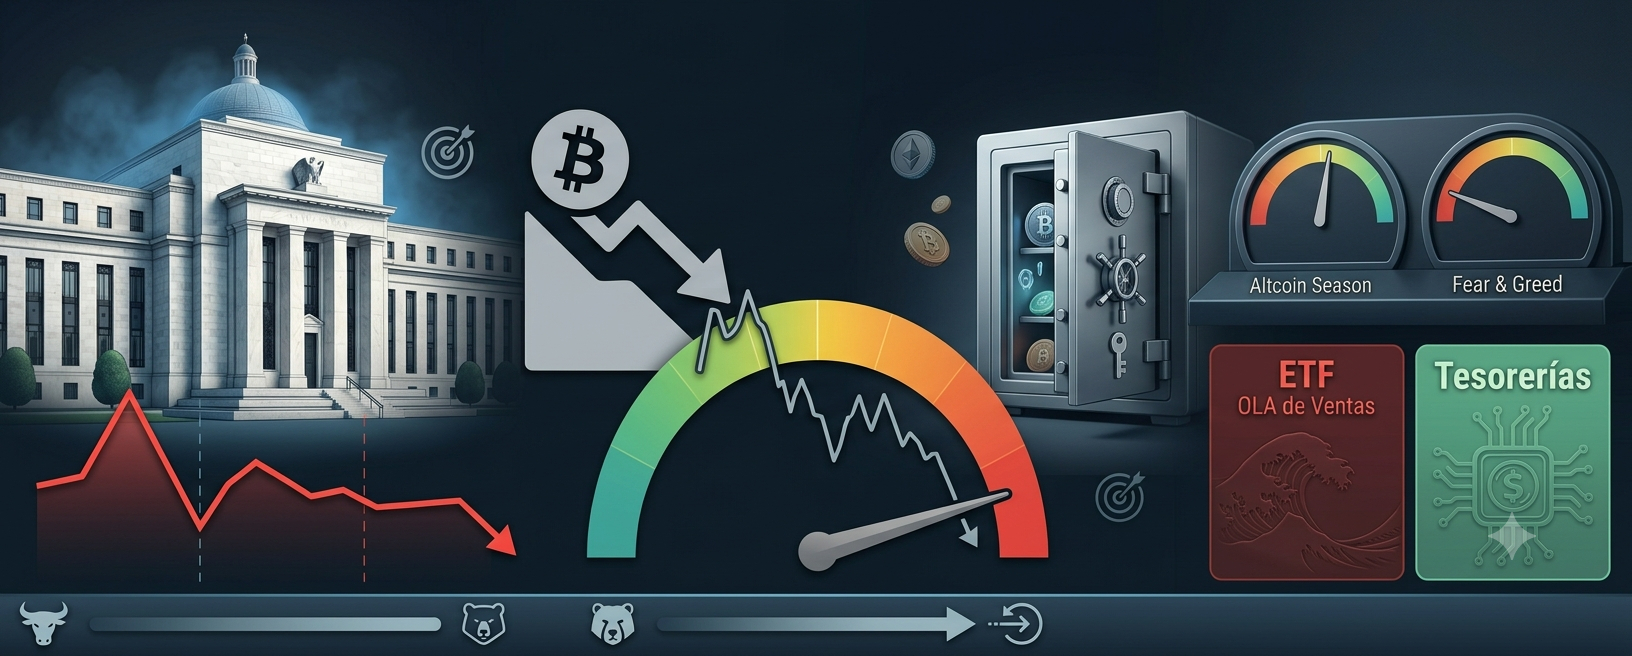
 #June 2026 wrap-up. Bitcoin below $60,000, the Fear & Greed stuck at 13, altcoins bleeding and a market that seems unable to find a floor. But if you’re only watching the BTC chart, you’re missing the whole movie. The real trigger for this correction didn’t come from a chart: it came from the Federal Reserve.
Let’s go step by step, from the macro to the micro, because everything is connected.
🏛️ The Fed changed hands — and so did the tone
June 17 was the first FOMC with Kevin Warsh as Fed chair, after he took over in May. And he made his debut by breaking the script.
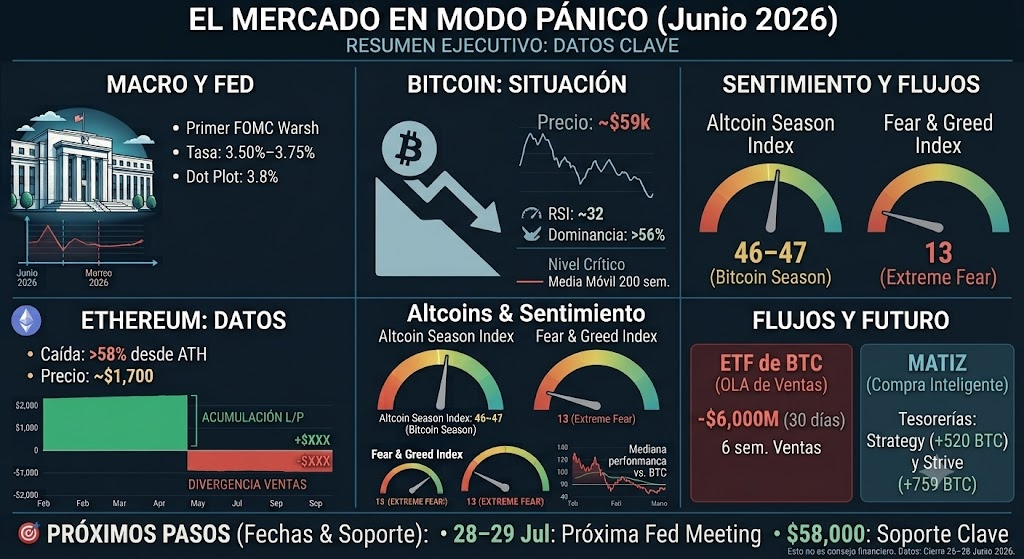
The rate stayed the same, at 3.50%–3.75%, the fourth consecutive meeting with no change. That was priced in. What nobody had priced was the dot plot: the median rate for end of year jumped to 3.8% from the 3.4% projected in March. Translated: expectations of rate cuts for 2026 are over, and now the debate is whether there will be another hike before December. Nine of eighteen members already expect at least one increase. Only one expects a cut.
The result was immediate: around $2 trillion evaporated across stocks, gold, silver, and Bitcoin within minutes.
And to make matters worse, Warsh announced that the Fed is stopping forward guidance—those telegraphed signals about the next move that the market had been using as a compass for years. They call it the “Warsh Premium”: more uncertainty the market has to discount in every data point, in every meeting. For us, who trade volatility, it means one concrete thing: every Fed date is now a potential bomb.
The backdrop doesn’t help. Inflation is still sticky between 3.8% and 4.2%, worsened by the energy shock from tensions in the Middle East. The Fed cut its growth projection to 2.2% and no longer expects inflation to return to 2% until 2028. Higher for longer—seriously this time.
📉 Bitcoin: below everything
In this context, BTC did what it had to do: fall. From $65,000 on June 22 to around $59,000 on June 26. Down nearly 18% for the month.
Technically, the picture is ugly and there’s no need to dress it up. Price is below the daily EMA20, EMA50, and EMA200—textbook bearish regime. The daily RSI is around 32: deep stress, but still no real capitulation. BTC dominance remains above 56%, confirming that weakness starts from the top and spreads downward.
The level everyone is watching is the 200-week moving average—historically the last line of defense of major cycles. And it adds mechanical risk with a $10 billion options expiry flagged by Bloomberg, which can amplify any directional move. To size it up: we’re more than 50% below the all-time high from late 2025.
🏦 Institutional bleed (with an important nuance)
Here’s the part that the headlines tell only halfway.
Yes, Bitcoin ETFs lived through the biggest wave of redemptions since they exist: about $6 billion over 30 days, six straight weeks of institutional selling. That’s real pressure, not noise.
But there are two nuances that change the read:
First, on June 23, flows turned positive again, with $39 million net inflow. One day doesn’t make a trend, but after six weeks of reds, getting the bleeding to stop is a data point.
Second, while the ETFs were selling, corporate treasuries kept buying. Strategy added 520 BTC. Strive put 759 BTC in at an average price of $65,850—i.e., buying above the current price, right in the middle of the fear zone. When “smart money” accumulates in Extreme Fear, it’s worth taking note.
This feeds the “ETF Wall” concept: the institutional capital that entered via BlackRock and Fidelity is effectively trapped in the BTC ecosystem. It doesn’t rotate into altcoins the way retail did in 2017. It’s money that just stays put in Bitcoin.
⟠ Ethereum: the most punished, but with an interesting divergence
ETH is having it worst: around $1,700, down nearly 58% from its August 2025 high of $4,954. It got hit by the ETF flow outflows and the delay of the Glamsterdam upgrade, which was the network catalyst the market was waiting for.
But there’s one piece of data that breaks the straight-line pessimism: Glassnode’s Hodler Net Position Change—which measures accumulation by medium- and long-term holders—has stayed green continuously since February 24. In the February 2026 drop, that same indicator had turned red and conviction was broken. Not this time. Long-term holders are treating this sell-off as a buy zone, not a panic zone.
It’s the fight for the floor: weakness from flows versus absorption driven by conviction. Whoever wins defines the bottom.
🌐 Altseason? Not even close
For those waiting for the rotation into alts: the Altcoin Season Index is at 46–49, firmly in “Bitcoin Season” territory. The confirmation threshold is 75, and the technical condition analysts repeat is that BTC dominance must lose the 55% level. We’re not there.
The median altcoin is about 79% below its cycle peak. What moves are selective rallies and narratives—AI, GameFi, RWA, tokenization of real-world assets—not a broad market upswing. In this environment, buying “generic alts” hoping the tide will lift them is fighting the flow. What works is being surgical: specific catalysts, not basket bets.
😱 Extreme Fear: the other side of the coin
Fear & Greed in 13 is scary—and for good reason. But historically, periods of extreme fear coincided more with accumulation zones than with ceiling zones.
And there’s a structural factor that lowers the risk of a violent collapse: leverage has already been cleaned out. Funding is neutral (around 0.0022% every 8 hours), open interest has been falling, and recent liquidations—more than $700 million in 24 hours, with 84% of positions long—show that overleveraged longs have already been wiped. A market that has already purged its leverage has less fuel for a surprise cascade.
This isn’t a buy signal. It’s context. The market isn’t expensive or overleveraged: it’s scared and lacking buyer conviction.
🔭 What to watch from here
• July 28–29: next Fed meeting. It’s the top macro catalyst. Any inflation data in between moves the market.
• $58,000: BTC’s immediate structural support. Below that, the path opens toward $55,000.
• BTC dominance at 55%: the technical trigger to seriously talk about rotation into altcoins.
• ETF flows: if the positive turn from June 23 holds, it changes the institutional narrative.
• ETH/BTC: as long as Ethereum doesn’t show relative strength versus Bitcoin, there’s no altseason worth having.
🎯 The reading
The regime is bearish, and there’s no point denying it. The macro wind is blowing straight in your face: a hawkish Fed, rate cuts off the table, a firm dollar, and Treasury yields above 4.4%. As long as that doesn’t change, bounces will be tactical, not structural.
But beneath the panic there are pieces that don’t fit a top: leverage has already been purged, long-term holders are absorbing, corporations are buying above the price, and sentiment is at extreme lows. These are the ingredients used to build floors, not ceilings.
The Warsh era means one thing for sure: more volatility around every Fed date. Anyone who trades this without strict risk management is going to have a bad time. Anyone who respects the levels and position sizing will have opportunities on both sides.
It’s not about guessing the bottom. It’s about being there when it arrives.
⚠️ This is not financial advice. Everyone manages their own risk.
Data as of the close of June 26–28, 2026.