
This model calculates the deviation of price from the fair value derived from the Stock to Flow model.
This indicator identifies periods when the market is significantly overvalued relative to this price average, or conversely, when BTC is undervalued.
In other words, based on available historical data, we can say :
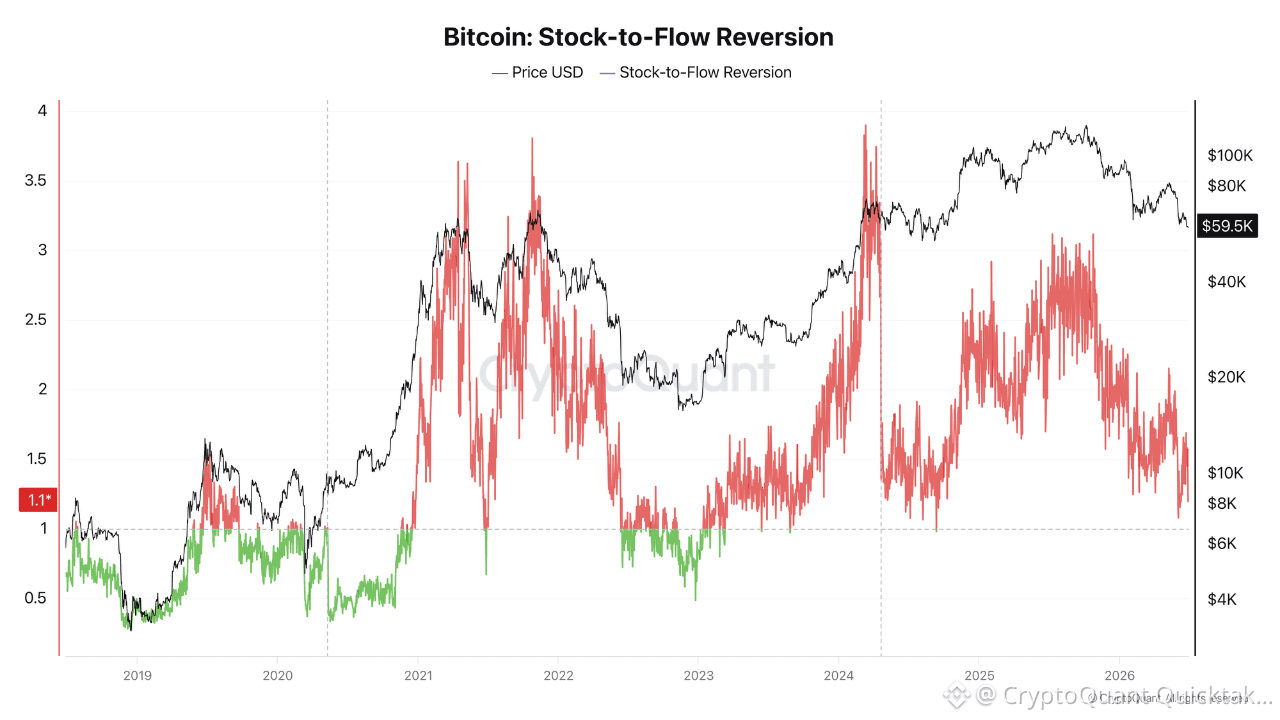
🔴 S2F Reversion > 2.5 - 3
This is when overvaluation starts becoming extreme, particularly above 3, and this has historically corresponded with a short-term trend reversal.
🟢 S2F Reversion < 1
You can easily see this on the chart, this value corresponds to bottom formation before a trend reversal.
Today the model gives a value of 1.1, so we’re approaching the level of extreme undervaluation.
The last time we went below 1 was only brief, in September 2024, when BTC was trading around $57 000.
It’s interesting to note that we’re arriving at a similar setup.
This isn’t the first indicator suggesting BTC is on the edge of a cliff, and that the market could potentially face one more, perhaps final, capitulation wave before stabilizing for good.
Written by Darkfost