
The current spot and contract prices of LUNA2 are basically on par, with a minimal price difference. The market is in a short-term rebound but has a long-term weak pattern. The price has significantly increased in the last 24 hours, but the trading volume has severely shrunk, only 0.5 times the 24-hour average, which is a typical case of 'price increase without volume.' The liquidity in the contract market has sharply dried up, with trading volume plummeting over 90%, but the ratio of open contracts to market value is extremely high, indicating high market leverage and fragile sentiment. Overall, it is in a technically rebounding phase within a weak oscillation.
Key prices and range structure
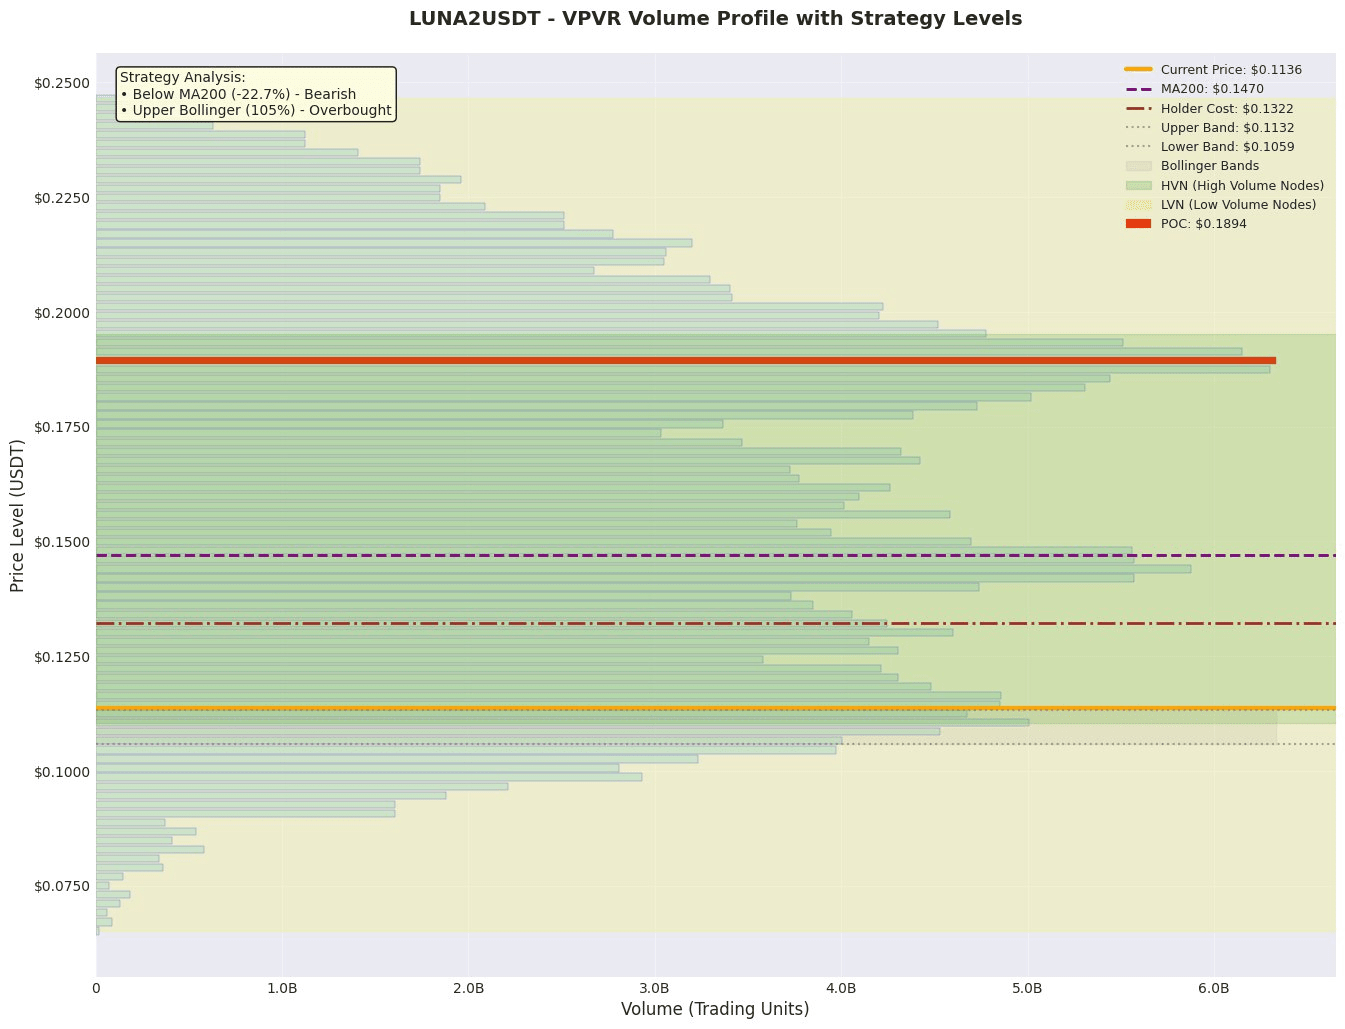
1. Value anchoring zone: According to VPVR data, the current market value anchor (POC) is at 0.189, significantly higher than the current price. The value area is between 0.1046 and 0.2012. The current price of 0.1136 is situated near the lower edge of this value area, which can be seen as a temporary dynamic support. If it breaks down, the price may seek lower support; if it moves upward, the POC at 0.189 and the upper edge of the VA at 0.2012 will constitute strong resistance.
2. Trend and Volatility Range: Price (0.1136) is significantly below MA200 (0.147), deviating by about 22.7%, confirming that the medium to long-term trend is still clearly downward. Meanwhile, the price has touched or slightly broken through the upper Bollinger Band (0.1132), indicating a short-term overbought state, with potential technical correction pressure. The current volatility range has narrowed between the upper and lower Bollinger Bands (0.1059 - 0.1132).
3. High Volume / High Concentration Zone (HVN): Data is missing. However, based on the Value Area range (0.1046 - 0.2012), it can be inferred that this area is generally a high volume zone in recent times, and prices may fluctuate repeatedly within this range.
Derivatives and Liquidity Analysis
• Leverage Bias and Crowding: The funding rate is extremely low (0.00000110), and the long-short ratio has slightly increased from 1.2740 to 1.2788, indicating a slight bias towards long positions, but the bullish sentiment is extremely tepid and not enthusiastically bullish. However, the OI/market cap ratio has reached 72.95%, which is a dangerous signal, indicating that the contract market has accumulated excessive leverage relative to its market cap, making the market structure weak and prone to cascading liquidations due to price fluctuations.
• Liquidity Signals: Contract trading volume plummeted by 91.4% within 24 hours, which is a typical signal of liquidity exhaustion. Market participation is extremely low, and large orders can easily cause sharp price fluctuations.
• Leverage and Position Recommendations: In the current environment of liquidity exhaustion and excessive leverage crowding, it is absolutely inappropriate to amplify leverage. Investors are advised to reduce their positions and primarily adopt a wait-and-see approach, or only conduct exploratory operations with very small positions to avoid becoming a victim of liquidity shortage.
News and Event Impact
News summaries indicate that market focus is on 'LUNA down 4.18%, affected by broader market weakness and a year-long decline' and analysis of its future prospects. The overall sentiment of these news is bearish, reflecting the long-term downward pressure faced by the asset and challenges in the overall market environment, which may further suppress market bullish confidence, resonating with the current technical weakness.
Trading Strategy
Plan A: Short Selling on Rebound (Conservative / Trend-Following Plan)
• Direction: Short
• Logic: Price touches the upper Bollinger Band, short-term overbought; the medium to long-term trend is suppressed by MA200; trading volume shrinkage does not support sustained increases.
• Entry Range: Around 0.1132 (Upper Bollinger Band).
• Stop Loss: 0.1190 (Above the recent potential resistance zone or breaking the previous high).
• Target: 0.1059 (Lower Bollinger Band) or 0.1046 (Lower edge of Value Area).
• Expected Risk-Reward Ratio: Based on entry at 0.1132, stop loss at 0.1190, target at 0.1059, risk of 0.0058, potential profit of 0.0073, the risk-reward ratio is approximately 1.26.
Plan B: Breakout Long (Aggressive / Counter-Trend Quick Strike Plan)
• Direction: Long
• Logic: If the price can strongly stabilize above the upper Bollinger Band with volume (needs to be observed), it may initiate a short-term strong trend.
• Entry Condition: Price increases in volume (trading volume recovers above the 24h average) confirms the breakout of 0.1132 and stabilizes.
• Stop Loss: 0.1100 (Below the breakout candlestick low).
• Target: 0.1250 (Recent chip pressure level) or 0.1470 (Near MA200).
• Expected Risk-Reward Ratio: Based on entry at 0.1140, stop loss at 0.1100, target at 0.1250, risk of 0.004, potential profit of 0.011, the risk-reward ratio is approximately 2.75. (This strategy carries high risk and entry conditions must be strictly met)
Risk Alerts and Position Management
1. Main Risks:
• Liquidity Risk: Contract trading volume plummeted by 91.4%, and the market depth is insufficient, which may result in stop loss orders being difficult to execute at the intended price, with a significant slippage risk.
• High Leverage Structural Risk: The OI/market cap ratio has reached 72.95%, indicating that the market has accumulated excessive leverage. Once the price experiences a reverse fluctuation, it may trigger severe long and short squeezes, exacerbating volatility.
• Trend Risk: The price is below MA200 by 22.7%, and the medium to long-term downward trend remains unchanged; any rebound may merely be a continuation of the decline.
2. Position and Risk Control Recommendations:
• Absolutely avoid high leverage; it is recommended to use leverage below 5 times or only engage in spot trading.
• Adopt a strategy of gradually testing small positions; the risk exposure of any single trade should not exceed 1%-2% of total funds.
• Before the current extreme liquidity indicators (plummeting trading volume) and emotional indicators (high OI/market cap ratio) improve, actively maintain low positions or delay entry, waiting for the market structure to become healthier.
Like and follow for real-time updates!
$LUNA2